
Fig. 6
- ID
- ZDB-FIG-230710-48
- Publication
- Hadzhiev et al., 2023 - The miR-430 locus with extreme promoter density forms a transcription body during the minor wave of zygotic genome activation
- Other Figures
- All Figure Page
- Back to All Figure Page
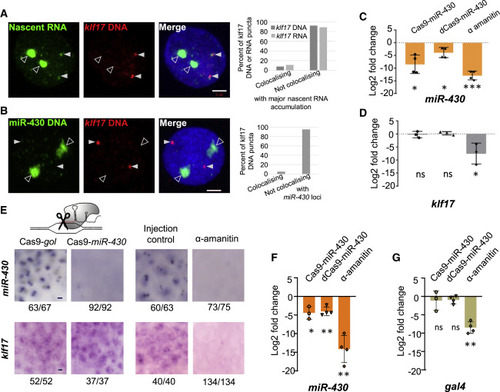
miR-430 manipulations do not influence early zygotic transcription of minor wave genes on other chromosomes (A) Nascent RNA (green) combined with FISH for klf17 DNA (red) and DAPI (blue) in WT 512-cell stage embryos counter-stained with DAPI (blue). 59 nuclei from 16 embryos. Right, chart shows frequency of colocalization frequency between klf17 DNA or RNA and major nascent RNA accumulation (transcription body) in 3D space (59 and 54 nuclei, respectively). (B) Double DNA-FISH labeling the miR-430 cluster (green) and the klf17 locus on chr2 (red) in WT 512-cell embryos counter-stained with DAPI (blue). 51 nuclei from 8 embryos. Chart shows frequency of colocalization between klf17 DNA and miR-430 DNA in 3D space. White arrowheads indicate klf17 locus, open arrowheads (A and B) indicate the miR-430 transcription body in (A) and (B). (C and D) Change in expression in WT 512-cell stage embryos, following manipulations, for miR-430 normalized to 5S rRNA (C), and klf17 normalized to TBP mRNA (D). Charts show mean log2(fold change) between Cas9/dCas9 targeting a control vs. targeting miR430, or α-amanitin treatment compared with injection control, from 4 biological repeats. (E) Nascent miR-430 (top) or klf17 RNA (bottom) staining at 512-cell following manipulations. Numbers indicate frequency of staining pattern, scale bars, 5 μm. (F and G) Relative change in expression, in Tg(Xla.crygc:attP-Gal4vp16,14UAS:Clover)UoBL1 embryos, at the 512-cell stage, following manipulations, for miR-430 RNA, normalized to 5S rRNA (F), or gal4 RNA normalized to TBP mRNA (G). Charts show mean log2(fold change) between Cas9 (n = 3 biological repeats) or dCas9 (n = 4) targeting, a control vs. targeting miR-430, or α-amanitin treatment compared with injection control. (C, D, F, and G) Error bars represent standard deviation and asterisks indicate significance: ns, p > 0.05, ∗p < 0.05, ∗∗p < 0.005 and ∗∗∗p < 0.0005 (unpaired t test). See also Figures S5 and S6. |
Reprinted from Developmental Cell, 58, Hadzhiev, Y., Wheatley, L., Cooper, L., Ansaloni, F., Whalley, C., Chen, Z., Finaurini, S., Gustincich, S., Sanges, R., Burgess, S., Beggs, A., Müller, F., The miR-430 locus with extreme promoter density forms a transcription body during the minor wave of zygotic genome activation, 155170.e8155-170.e8, Copyright (2023) with permission from Elsevier. Full text @ Dev. Cell