
Figure 5.
- ID
- ZDB-FIG-230710-24
- Publication
- Hasel de Carvalho et al., 2023 - The Opto-inflammasome in zebrafish as a tool to study cell and tissue responses to speck formation and cell death
- Other Figures
-
- Figure 1—figure supplement 1.
- Figure 1—figure supplement 1.
- Figure 2.
- Figure 3—figure supplement 1.
- Figure 3—figure supplement 1.
- Figure 4.
- Figure 5.
- Figure 6—figure supplement 1.
- Figure 6—figure supplement 1.
- Figure 6—figure supplement 2.
- Figure 6—figure supplement 3.
- Figure 7—figure supplement 1.
- Figure 7—figure supplement 1.
- Figure 7—figure supplement 2.
- Figure 8—figure supplement 1.
- Figure 8—figure supplement 1.
- Figure 8—figure supplement 2.
- All Figure Page
- Back to All Figure Page
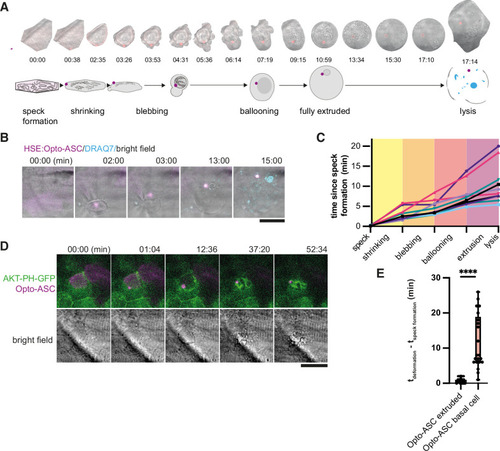
Stages of ASC-speck-induced e extrusion from the periderm. ( |