FIGURE

FIGURE 2

ID
ZDB-FIG-230625-5
Publication
Liu et al., 2023 - Retinal degeneration in rpgra mutant zebrafish
Other Figures
All Figure Page
Back to All Figure Page
FIGURE 2

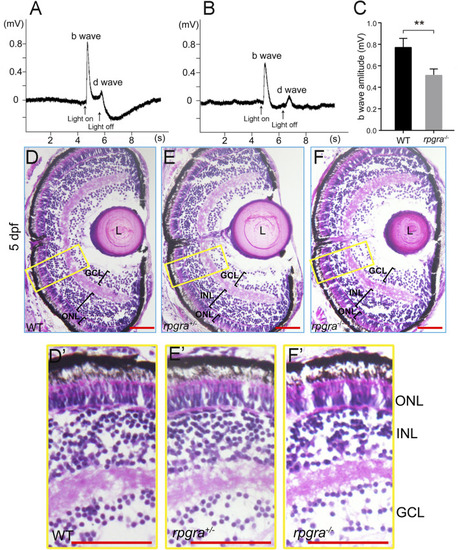
Visual impairment in the rpgra−/− larval zebrafish. (A) Detection of visual function by ERG analysis of WT zebrafish at 5 dpf. (B) Detection of visual function by ERG analysis of rpgra−/− zebrafish at 5 dpf. (C) Comparison of b-wave amplitudes between WT (n = 5) and rpgra−/− (n = 6) zebrafish using two-tailed Student’s t-test. The result is shown as mean ± SD. **, p < 0.01. (D–F) Histological analyses of WT, rpgra+/−, and rpgra−/− zebrafish at 5dpf. Cryosections were stained with hematoxylin and eosin. (D′–F′) Enlarged images of the area inside the yellow box in the (D–F). ONL, outer nuclear layer; INL, inner nuclear layer; GCL, ganglion cell layer; L, Lens. Scale bars, 50 µm.

Expression Data

Expression Detail
Antibody Labeling
Phenotype Data

Phenotype Detail
Acknowledgments
This image is the copyrighted work of the attributed author or publisher, and ZFIN has permission only to display this image to its users. Additional permissions should be obtained from the applicable author or publisher of the image. Full text @ Front Cell Dev Biol