
Fig. 3
- ID
- ZDB-FIG-230605-3
- Publication
- Wu et al., 2022 - Assessment of stromal SCD-induced drug resistance of PDAC using 3D-printed zPDX model chips
- Other Figures
- All Figure Page
- Back to All Figure Page
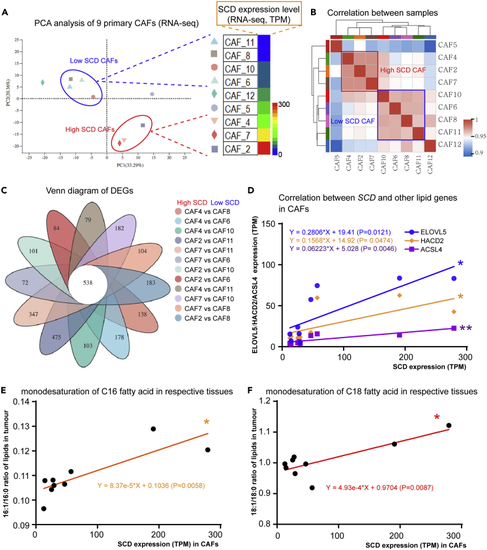
SCD expression characterizes CAF types and lipid metabolism (A) PCA analysis of 9 primary CAFs depending on SCD expression level (RNA-seq). (B) Correlation analysis of the CAFs’ transcriptomic profiles. (C) 538 DEGs identified among 12 paired primary SCDlow CAF and SCDhigh CAF. (D) Correlation analysis on SCD expression level and lipid genes (ELOVL5, HAC02, and ACSL4) on CAFs. (E) Correlation analysis between SCD expression in CAFs and the C16 fatty acid monodesaturation ratios in the respective PDAC tissues. (F) Correlation analysis between SCD expression in CAFs and the C18 fatty acid monodesaturation ratios in the respective PDAC tissues. p < 0.05 was considered significant. |