
- Title
-
Assessment of stromal SCD-induced drug resistance of PDAC using 3D-printed zPDX model chips
- Authors
- Wu, C., Hu, B., Wang, L., Wu, X., Gu, H., Dong, H., Yan, J., Qi, Z., Zhang, Q., Chen, H., Yu, B., Hu, S., Qian, Y., Dong, S., Li, Q., Wang, X., Long, J.
- Source
- Full text @ iScience

Expression patterns and prognosis value of SCD in PDAC samples (A) Kaplan-Meier curves for OS in TCGA cohort (N = 176) with PDAC based on SCD expression levels. (B) Correlation between the SCD expression levels and Stromal/Immune Scores (ESTIMATE). (C) Kaplan-Meier curves for OS in TCGA cohort with PDAC based on SCD expression and stromal score (ESTIMATE). (D) Kaplan-Meier curves for OS in 31 patients with stroma-enriched PDAC based on SCD expression levels. The differences between the two curves were determined by the log rank (Mantel) test. (E) Phenotyping of the stroma-enriched PDAC samples, based on the staining of series sections, which were, from left to right, Alcian blue, SCD antibody, Masson staining, Sirius red staining, activated β-catenin antibody, and Hematoxylin. Scale bar: 20 μm. p < 0.05 was considered significant. |

Harvest of primary PDAC tumor cells and CAFs for zPDX models (A) Type proportions of the twelve stroma-enriched surgical-resected PDAC tissues from local hospital. (B) Schematic procedure to isolate CAFs and tumor cells from primary PDAC tissues. (C) Representative fluorescent images of the primary CAFs transfected by lentivirus (EFS: BCL2L1-P2A-eGFP). (D) Representative fluorescent images of the primary tumor cells transfected by lentivirus (EFS: mKate2). (E) Schematic procedure to generate the stromal-tumor-mixed zPDX models in scd−/−/prkdc−/− zebrafish larvae and alignment of the zPDX models in a microarray chip. Scale bar: 20 μm. |
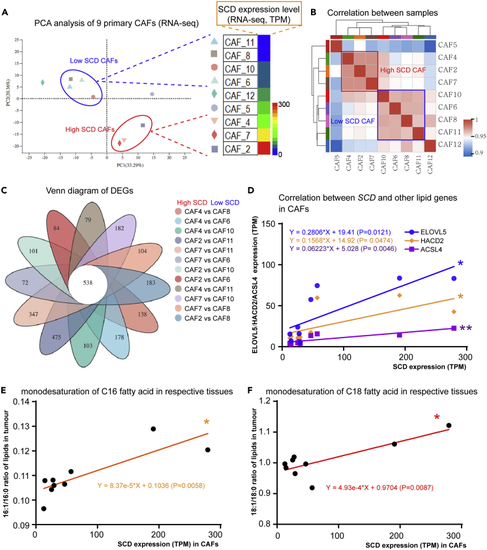
SCD expression characterizes CAF types and lipid metabolism (A) PCA analysis of 9 primary CAFs depending on SCD expression level (RNA-seq). (B) Correlation analysis of the CAFs’ transcriptomic profiles. (C) 538 DEGs identified among 12 paired primary SCDlow CAF and SCDhigh CAF. (D) Correlation analysis on SCD expression level and lipid genes (ELOVL5, HAC02, and ACSL4) on CAFs. (E) Correlation analysis between SCD expression in CAFs and the C16 fatty acid monodesaturation ratios in the respective PDAC tissues. (F) Correlation analysis between SCD expression in CAFs and the C18 fatty acid monodesaturation ratios in the respective PDAC tissues. p < 0.05 was considered significant. |

Assembly of the zPDX microarray chips to assess their responses to chemotherapy (A) 3D-printed molds of separated PDMS wells, agarose mini-capsules, and the covers of the well. Two holes on each cover to add drugs and replace the solution every 6 h. (B) The representative scanning images of a zPDX model chip at 0 hpt (hours post drug treatment) and 60 hpt in green and red fluorescent channels, and a representative quantitative analysis for the fluorescent signals of the tumor cells (red) and the fibroblasts (green). (C) Summarized heatmap of the normalized viability of PDAC tumor cells in the drug-treated groups compared to the DMSO-treated control group. GEM: Gemcitabine; PTX: Paclitaxel; CPT-11: Irinotecan; NVB: Vinorelbine; DDP: Cisplatin; TGO: Tegafur. Scale bar: 300 μm. |

SCD inhibitors repress the pro-tumor and drug-resistant properties of SCDhigh CAFs (A) Maximal tolerance dose (MTD) of three SCD inhibitors (MK-8245, MF-438, and Aramchol) for 60 hpf zebrafish larvae. (B) Representative images of immune staining of MET, KRAS, HRAS, ACTA2, CXCR5, and COL6A2 in the PDAC tissues from patient #2. (C) Representative confocal fluorescent images of the lateral views of the zPDX models xenografted by PDAC #2 (Red) mixed with CAFs from patient #2 or #7 (Green) treated by GEM, DDP with or without the administration of the SCD inhibitor aramchol. (D) Statistics of the fluorescence intensity of the PDAC cells in chemotherapy-treated zPDX models with or without all three SCD inhibitors. (E) Schematic diagram of the CAF-derived unsaturated fatty acids contributing to the drug resistance of PDACs against DDP and GEM. (F) Application of the “chemotherapy PLUS” protocol to fast predict the therapeutic efficacy of novel target inhibitors using zPDX models. Scale bar: 50 μm. p < 0.05 was considered significant. |