
Figure 5
- ID
- ZDB-FIG-230501-152
- Publication
- Pose-Méndez et al., 2023 - Lifelong regeneration of cerebellar Purkinje cells after induced cell ablation in zebrafish
- Other Figures
- All Figure Page
- Back to All Figure Page
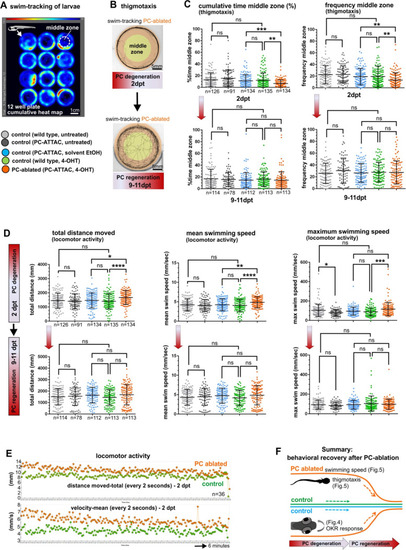
(A) Heat map representing the location of zebrafish larvae in a 12-well plate during 6 min of swimming. (B) Example of swim track after PC ablation (2 dpt) and during regeneration (10 dpt) phases. (C) Quantitative analysis of swim preferences along the edge vs center zone of the arena (frequency of visits and percentage of time spent in the center zone) in PC-ablated larvae vs control groups. (D) Quantitative analysis of locomotor activity (total distance traveled, mean and maximum swimming speed) in PC-ablated larvae vs controls. (E) Graphs showing distance traveled and swim speed every 2 s during the tracking period, comparing PC-ablated vs control larvae. (F) Illustration summarizing impairment and recovery of optokinetic response (OKR) (Figure 4) and locomotor behavior during PC degeneration and early regeneration phases, respectively.The data from free swim tests correspond to the results from four independent ablations that were pooled. Statistical information: size sample n=78-135, statistical method=ANOVA Kruskal-Wallis, Dunn´s multiple comparisons test, levels of significance=P<0.05 (*), P<0.01 (**), P<0.001 (***), P<0.0001 (****). Additional information in Supplementary file 1.
|