
Figure 3
- ID
- ZDB-FIG-230501-144
- Publication
- Pose-Méndez et al., 2023 - Lifelong regeneration of cerebellar Purkinje cells after induced cell ablation in zebrafish
- Other Figures
- All Figure Page
- Back to All Figure Page
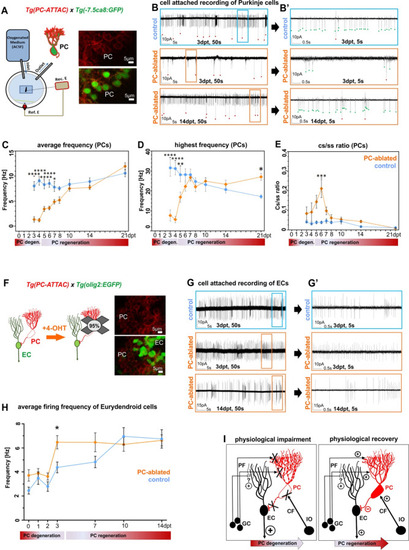
(A) Patch-clamp recording setup used for all experiments. Fluorescent PCs in larvae of the double transgenic line Tg(PC-ATTAC)/Tg(–7.5ca8:EGFP). (B) 50 s trace of representative recordings of the tonic firing activity in control larvae 3 days after EtOH or in PC-ablated larvae 3 and 14 days after 4-hydroxy-tamoxifen (4-OHT) treatment and (B’) 5 s traces for all three traces shown. Red dots mark complex spikes and green dots mark simple spikes. (C–E) Diagrams representing results of the electrophysiologic investigations in PCs. (C) Average tonic firing frequency plotted vs dpt. (D) Highest spontaneous bursting frequency over an interval of 1 s during a 100 s trace plotted vs dpt. (E) Ratio of the complex spikes to simple spikes vs dpt. (F) Illustration of PC loss after 4-OHT treatment and representative image of the PC layer from a double transgenic Tg(PC-ATTAC)/Tg(olig2:EGFP) larva. (G) 50 s trace of representative recordings of the tonic firing activity of ECs in control larvae 3 days after EtOH or in PC-ablated larvae 3 and 14 days after 4-OHT treatment and (F) 5 s traces for all 3 traces shown. (H) Average tonic firing frequency of ECs after PC ablation plotted vs dpt. (I) Illustration of physiological impairment and recovery model of the input/output of PCs during PC degeneration and regeneration, respectively. Statistical information: sample size n=17-45, statistical method=2-Way ANOVA, Šídák's multiple comparisons test, levels of significance=P<0.05 (*), P<0.01 (**), P<0.001 (***), P<0.0001 (****). Additional information in Supplementary file 1.
|