
FIGURE
Fig. 5
- ID
- ZDB-FIG-230424-62
- Publication
- Huttunen et al., 2022 - Distinctive effects of SGLT2 inhibitors on angiogenesis in zebrafish embryos
- Other Figures
- All Figure Page
- Back to All Figure Page
Fig. 5
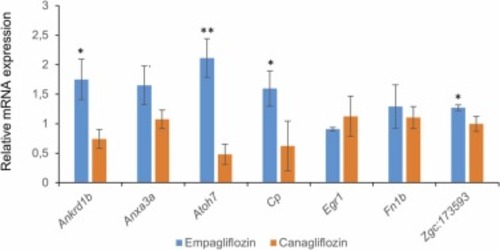
Upregulated gene expression in response to SGLT2 inhibitor treatments. For each gene n = 3. The results shown are representatives of three separate experiments. Data were analyzed with Student´s t-test (false discovery rate Q adjusted to 5%) and shown as mean + SD. **P < 0.01, *P < 0.05. |
Expression Data
Expression Detail
Antibody Labeling
Phenotype Data
Phenotype Detail
Acknowledgments
This image is the copyrighted work of the attributed author or publisher, and
ZFIN has permission only to display this image to its users.
Additional permissions should be obtained from the applicable author or publisher of the image.
Full text @ Biomed. Pharmacother.