
Fig. 1
- ID
- ZDB-FIG-230424-58
- Publication
- Huttunen et al., 2022 - Distinctive effects of SGLT2 inhibitors on angiogenesis in zebrafish embryos
- Other Figures
- All Figure Page
- Back to All Figure Page
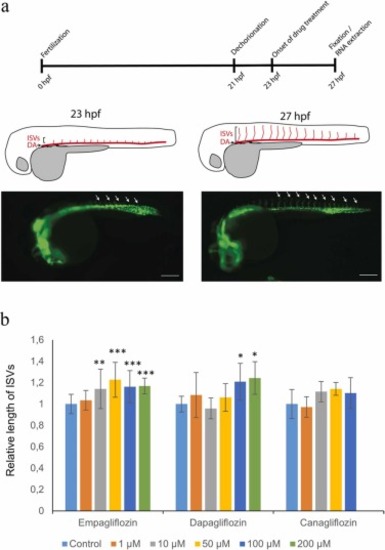
a Overview on the zebrafish experiments with a diagram of the forming intersegmental blood vessels (ISVs) at two time points (23 hpf and 27 hpf), and microscope images of live embryos. The quantified ISVs are marked with white arrows. DA stands for dorsal aorta, hpf for hours post fertilization. Scale bar 200 µm (1b) Quantification of SGLT2 inhibitor-regulated ISV growth. The length of the vessels is given as relative lengths to control embryos. The number of embryos analyzed in 0, 1, 10, 50, 100, and 200 µM of SGLT2 inhibitors: empagliflozin n = 18, n = 18, n = 15, n = 12, n = 16, n = 14, respectively; dapagliflozin n = 7, n = 4, n = 8, n = 8, n = 9, and n = 6, respectively; canagliflozin n = 6, n = 4, n = 9, n = 8, n = 5, and n = 0, respectively. Data were analyzed with Dunnett´s test and shown as mean +SD. ***P < 0.001, **P < 0.01, *P < 0.05. |