
Figure 6
- ID
- ZDB-FIG-230402-6
- Publication
- Streiff et al., 2023 - Susceptibility and Permissivity of Zebrafish (Danio rerio) Larvae to Cypriniviruses
- Other Figures
- All Figure Page
- Back to All Figure Page
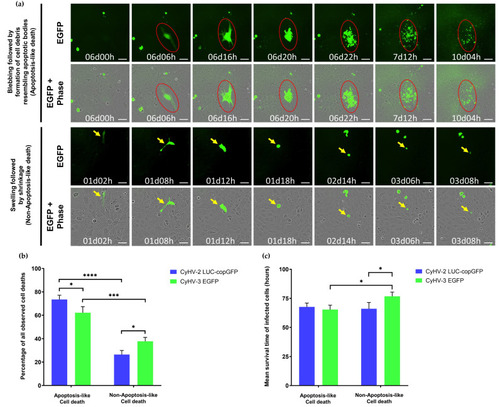
Cell death characteristics observed in CyHV-2 and CyHV-3 infections (a) Representative morphological observations among populations of infected cells (those exhibiting fluorescence) in the periods leading up to cell death (disappearance of fluorescence). Top panel: Morphological features consistent with apoptosis (cell shrinkage, membrane blebbing followed by the appearance of cell debris resembling apoptotic bodies, and progressive decrease of fluorescent signal). Bottom panel: Morphological features not consistent with apoptosis (cell swelling, followed by cell shrinkage, and absence of cell debris resembling apoptotic bodies prior to disappearance of fluorescent signal). Key examples of individual cells undergoing apoptosis-like and non-apoptosis-like death in each panel are highlighted by red circle and yellow arrows, respectively, which track the progression of morphology in a single cell with respect to time. Time postinfection (in days and hours) is indicated in images. Scale bars = 100 µm. (b) Percentage of infected cells exhibiting features of apoptosis-like or non-apoptosis-like cell death among those that died during the observation period (c) Mean survival time of infected cells undergoing cell death during the observation period according to the type of death observed. Data represents mean ± standard error from 3 replicates. **** p < 0.0001; *** p < 0.001; * p < 0.05. |