
Fig. 4
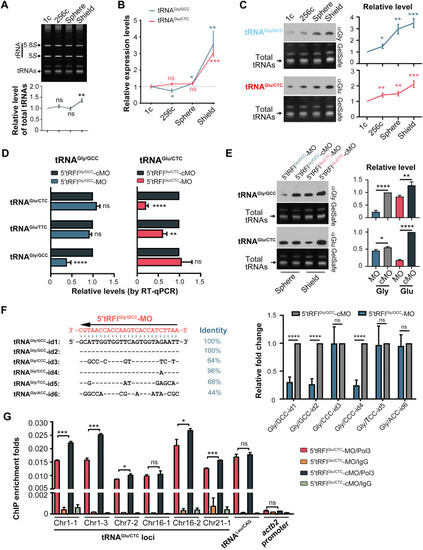
Loss of 5′tRFlGlu/CTC and 5′tRFlGly/GCC impairs normal tRNA gene transcription.
(A) Dynamics of total tRNAs during early embryogenesis. (B and C) Dynamics of full-length tRNAGly/GCC and tRNAGlu/CTC levels during early embryogenesis. Their levels were detected by both RT-qPCR (B) and Northern blot (C). The RT-qPCR values were normalized to that at the 1c stage. (C) Left: Northern blot and gel staining results. (C) Right: Relative level of tRNAGly/GCC and tRNAGlu/CTC based on the band intensity on the blot that was normalized to the average intensity of 5S and 5.8S rRNAs on gel. (D and E) Knockdown of 5′tRFlGly/GCC and 5′tRFlGlu/CTC down-regulates the level of related tRNA. Embryos at the 1c stage were injected with 10 ng of MO and collected at indicated stages for RT-qPCR (D) or Northern blot (E) as described in (B) and (C). (F) Effect of 5′tRFlGly/GCC-MO injection on the expression of different tRNAGly isoacceptors/isodecoders (id) with divergent sequences. Left: Sequence comparison among different tRNAGly in the 5′tRFlGly/GCC-MO targeting sequence. The identical nucleotides are indicated by “-”. Note that tRNAGly/GCC-id1 and tRNAGly/GCC-id2 have different nucleotides in the remaining part (as shown by the primers in table S3) of tRNA sequence. Right: Expression levels of indicated tRNAGly. 1c stage embryos were injected with 10 ng of MO per embryo and collected at the sphere stage for RT-qPCR analysis. (G) ChIP-qPCR results showing a reduction of Polr3a binding to tRNAGlu/CTC genes in 5′tRFlGlu/CTC morphants. 1c stage embryos were injected with 10 ng of 5′tRFlGlu/CTC-MO or 5′tRFlGlu/CTC-cMO and harvested at 6 to 8 hpf for ChIP assay using Polr3a antibody or immunoglobulin G (IgG). The immunoprecipitated DNA was used for amplifying the indicated loci using specific primers. Data are shown as averages with ±SD from three independent experiments. ns, nonsignificant with P > 0.05; *P < 0.05; **P < 0.01; ***P < 0.001; ****P < 0.0001 (Student’s t test, two-tailed). |