
Fig. 4
- ID
- ZDB-FIG-230315-107
- Publication
- Anneser et al., 2022 - The neuropeptide Pth2 modulates social behavior and anxiety in zebrafish
- Other Figures
- All Figure Page
- Back to All Figure Page
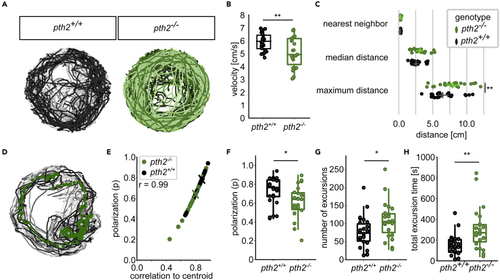
Fish move in a less cohesive manner in groups of pth2−/− animals (A) Example traces of 20 fish over 1 min in the behavioral tank Fish movement was strongly coordinated across all replicates. For pth2−/−, n = 26, for wildtype, n = 29. (B) Boxplots depict the median movement speed of fish over 30 min. Wild-type animals moved on average faster than fish without pth2 (unpaired, two-sided t-test, pt=2.938, df=50 = 0.01, median velocity of wildtype: 5.9 cm/s, for mutant: 4.9 cm/s). (C) Dot plots highlight the increased distance between pth2−/− fish when compared to wild-type animals. In an ANOVA, genotype was found to be a significant factor for distance (pF=10.15 = 0.002), Tukey’s post-hoc range test then showed the maximum distance was significantly different between genotypes (pq=5.21 = 0.004, median maximum distance in wildtype: 4.60 cm, for mutants: 6.49 cm). All datapoints shown are the median across all fish within one experiment. (D) Trajectories of wild-type animals over 1 min with the trajectory of the shoal centroid overlaid as green dotted line. (E) Polarization of animals was strongly correlated with the mean of the individual animals' correlation to the shoal centroid. Median values for pth2−/− and pth2+/+ are indicated by the colored x (Pearson’s r = 0.99, pt=94.92 = 1.2e-55). (F) The animals' polarization was significantly increased in wild-type animals (unpaired, two-sided t-test, pt=2.62,df=50 = 0.022, effect size: 0.75, mean of mutants: 0.61, mean of wildtype = 0.72). (G) Wild-type animals were more likely to consistently move in coherent groups, as evidenced by the increased propensity of pth2−/− animals to split away from the main group (unpaired, two-sided t-test, pt=2.51, df=50 = 0.032, effect size = 0.72, mean number of excursions in mutants: 108.9, in wildtypes: 75.5). (H) The smaller number of excursions in wild-type animals was not compensated for by a longer total excursion time (unpaired, two-sided t-test, pt=3.40, df=50 = 0.002, effect size: 0.97, mean total excursion time in mutants: 303.9 s, in wildtype: 151.9 s) |
| Fish: | |
|---|---|
| Observed In: | |
| Stage: | Days 45-89 |