
- Title
-
The neuropeptide Pth2 modulates social behavior and anxiety in zebrafish
- Authors
- Anneser, L., Gemmer, A., Eilers, T., Alcantara, I.C., Loos, A.Y., Ryu, S., Schuman, E.M.
- Source
- Full text @ iScience

Validation of pth2sa23129 fish lacking a functional peptide (A) The pth2 gene consists of three exons; the coding sequence (CDS) is contained in exon 2 and 3. In pth2sa23129 fish, a T/A point mutation induces a premature stop codon within the propeptide sequence, thus preventing the successful translation and cleavage of the Pth2 peptide. (B) Homozygous mutants were validated by sequencing and the premature ochre stop codon was identified at base pair 165 out of 474 of the CDS. (C) Pth2+ cells are only found at the lateral edge of the dorsal thalamus, imaged here in a dorsoventral orientation. Transcript levels of pth2 were strongly decreased in pth2−/− animals, as demonstrated by fluorescent in-situ hybridization, although some remaining signal was detected (arrowheads). Abolished Pth2 translation was validated using a custom antibody recognizing a 27-mer epitope immediately preceding the peptide sequence (Anneser et al., 2020). For both wildtype and pth2−/−, 6 larvae at 6 dpf were imaged. Scale bar: 10 μm. R: rostral, (C) caudal. See also Figure S1 |
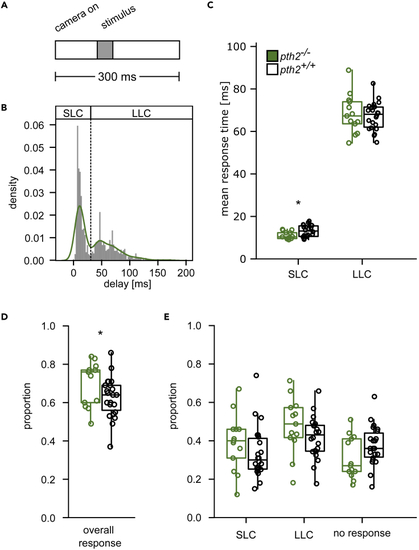
pth2−/− fish display increased startle propensity (A) Experimental scheme. Ten larval fish (5 dpf) were recorded with 500 Hz for 300 ms. After a baseline of 100 ms, a 40-ms pulse was delivered using a bass shaker. (B) The histogram and overlaid kernel density estimate show the delay with which animals respond after the onset of the stimulus with a C-start. We recorded 1613 escape responses from 220 wild-type fish and observed the bimodal distribution characteristic of Mauthner-cell-mediated short-latency C-starts (SLC) (Burgess and Granato, 2007) and long-latency C-starts (LLC) mediated by a prepontine cell group (Marquart et al., 2019). (C) Delay after stimulus until escape onset is shown as a boxplot for wild-type and pth2−/− animals. Single dots represent the mean of individual experiments. We tested the mean response rate differences between genotypes using a Mann-Whitney-U test and found SLCs in pth2−/− fish occured slightly earlier (pU=79 = 0.015, Cohen’s d = 0.81, μpth2−/− = 10.9 ms, μpth2+/+ = 12.8 ms), while LLCs were indistinguishable between genotypes (pU=138 = 0.439, Cohen’s d = 0.13, μpth2−/− = 66.9 ms, μpth2+/+ = 66.0 ms) (D) Boxplots show the fraction of animals that react to a stimulus with an escape response. Fractions were calculated for groups of 10 animals, with n = 13 for pth2−/− and n = 22 for wildtype. The proportion of pth2−/− animals performing an escape response as reaction to a startle stimulus was significantly increased as compared to wildtype (Mann-Whitney-U test, pt=92.0 = 0.042, Cohen’s d = 0.68, μpth2−/− = 0.7, μpth2+/+ = 0.62). (E) The boxplots show the proportion of pth2−/− and wild-type animals responding to a startle stimulus with an SLC, LLC, or the absence of a response. While no main effects were observed, we found the interaction between all response types was significantly related to the genotype in a logistic regression model (pF=6.95 = 0.013), arguing for a cross-over interaction. See also Figure S2. PHENOTYPE:
|
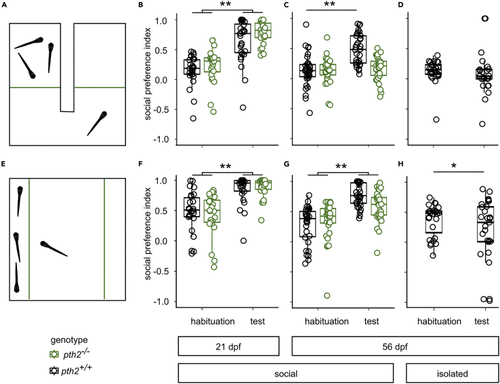
Maintenance of social preference is disrupted in pth2−/− mutants (A) Scheme of the U-shaped chamber, in which the experimental fish could spend time in either of two adjacent compartments, separated by acrylic glass (green line) (Dreosti et al., 2015). Visual access to three age-matched wild-type conspecifics was only possible in one of the two areas. (B) Boxplots indicate the preference for the social area displayed by pth2+/+ (n = 28) and pth2−/− fish (n = 24) at 21 dpf during habituation and in response to the presence of stimulus fish. While animals showed no preference during the habituation period, they spent a significantly increased amount of time close to conspecifics during the test period (two-way ANOVA, pF=93.02 = 5.94e-16). (C) At 56 dpf, both the presence of conspecifics (two-way ANOVA, pF=20.4 = 0.000015) and the genotype of the animals (two-way ANOVA, pF=13.94 = 0.0003; n = 32 for wildtype and 31 for mutants) contributed significantly to social preference. Additionally, we found a significant interaction between these factors (pF=13.89 = 0.0003). A post-hoc Tukey-Kramer test indicated that pth2+/+ fish displayed a significant increase in SPI under test conditions (pq=8.25 = 0.001), whereas pth2−/− fish did not (pq=0.72 = 0.9). (D) Boxplots show the effect of rearing animals in isolation on social preference. In 56 dpf animals, the presence of conspecifics led to no detectable change in behavior (n = 25; paired, two-sided t-test: pt=0.78, df =23 = 0.44, effect size = 0.13, mean social preference during habituation: 0.12, during test conditions: 0.08). (E) Scheme for open field social preference test, in which fish could move freely in a rectangular dish, while having visual access to three conspecifics. (F) Boxplots indicate social preference of wild-type (n = 26) and pth2−/− fish (n = 25) at 21 dpf during the habituation period and in response to stimulus fish. The presence of conspecifics during the test period altered behavior of all animals significantly (two-way ANOVA, pF=53.41 = 7.35e-11), while genotype did not influence behavior (two-way ANOVA, pF=0.46 = 0.49). (G) At 56 dpf, the presence of conspecifics (pF=56.23 = 1.14e-11) and its interaction with the test animal’s genotype (pF=7.25 = 0.008) significantly altered social preference (for pth2−/−, n = 32, for pth2+/+, n = 31). A post-hoc Tukey-Kramer test indicated a significant preference for the arm with conspecifics (when compared to the habituation period) in pth2+/+ fish (pq=10.15 = 0.001, effect size: 1.93). In pth2−/− fish, the same effect was present, although less pronounced (pq=4.88 = 0.004, effect size: 0.82). (H) After 8 weeks of social isolation, pth2+/+ fish displayed no social preference toward conspecifics and rather exhibited an avoidance reaction (two-sided, paired t-test: pt=2.06 = 0.049, n = 27) PHENOTYPE:
|
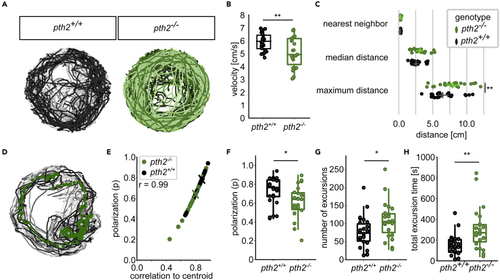
Fish move in a less cohesive manner in groups of pth2−/− animals (A) Example traces of 20 fish over 1 min in the behavioral tank Fish movement was strongly coordinated across all replicates. For pth2−/−, n = 26, for wildtype, n = 29. (B) Boxplots depict the median movement speed of fish over 30 min. Wild-type animals moved on average faster than fish without pth2 (unpaired, two-sided t-test, pt=2.938, df=50 = 0.01, median velocity of wildtype: 5.9 cm/s, for mutant: 4.9 cm/s). (C) Dot plots highlight the increased distance between pth2−/− fish when compared to wild-type animals. In an ANOVA, genotype was found to be a significant factor for distance (pF=10.15 = 0.002), Tukey’s post-hoc range test then showed the maximum distance was significantly different between genotypes (pq=5.21 = 0.004, median maximum distance in wildtype: 4.60 cm, for mutants: 6.49 cm). All datapoints shown are the median across all fish within one experiment. (D) Trajectories of wild-type animals over 1 min with the trajectory of the shoal centroid overlaid as green dotted line. (E) Polarization of animals was strongly correlated with the mean of the individual animals' correlation to the shoal centroid. Median values for pth2−/− and pth2+/+ are indicated by the colored x (Pearson’s r = 0.99, pt=94.92 = 1.2e-55). (F) The animals' polarization was significantly increased in wild-type animals (unpaired, two-sided t-test, pt=2.62,df=50 = 0.022, effect size: 0.75, mean of mutants: 0.61, mean of wildtype = 0.72). (G) Wild-type animals were more likely to consistently move in coherent groups, as evidenced by the increased propensity of pth2−/− animals to split away from the main group (unpaired, two-sided t-test, pt=2.51, df=50 = 0.032, effect size = 0.72, mean number of excursions in mutants: 108.9, in wildtypes: 75.5). (H) The smaller number of excursions in wild-type animals was not compensated for by a longer total excursion time (unpaired, two-sided t-test, pt=3.40, df=50 = 0.002, effect size: 0.97, mean total excursion time in mutants: 303.9 s, in wildtype: 151.9 s) PHENOTYPE:
|

ZFIN is incorporating published figure images and captions as part of an ongoing project. Figures from some publications have not yet been curated, or are not available for display because of copyright restrictions. PHENOTYPE:
|
|
Unillustrated author statements PHENOTYPE:
|