
Fig. 1
- ID
- ZDB-FIG-230312-53
- Publication
- Yoshimatsu et al., 2021 - Ancestral circuits for vertebrate color vision emerge at the first retinal synapse
- Other Figures
- All Figure Page
- Back to All Figure Page
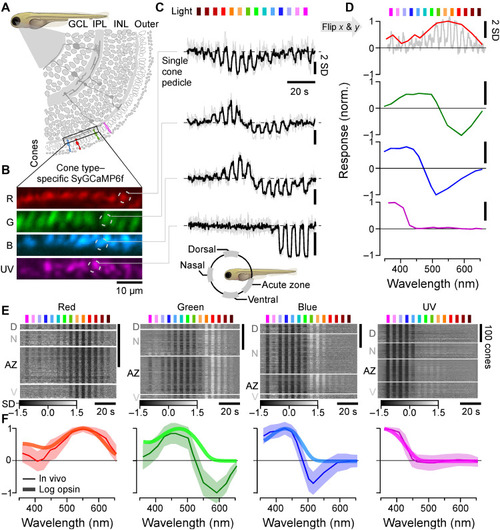
In vivo spectral tuning of larval zebrafish cones and HC block. (A) Schematic of larva zebrafish retina, with position of cone pedicles highlighted [adapted from (82)]. (B and C) Example scans of the four spectral cones (B) (Methods) with single pedicle response examples for each (C) to 3-s flashes of light from each of the 14 LEDs [see fig. S1 (A to C)]. The means superimposed on individual repeats are shown. (D) Example spectral responses summarized from (C). Note that in this representation, both the x and y axes are flipped relative to the raw responses. (E and F) Population responses of each cone type recorded in different parts of the eye (D, dorsal; N, nasal; AZ, acute zone; V, ventral; see schematic inset above for anatomical reference; vertical scale bars indicate n = 100 cones; see also fig. S1G) (E) and population mean ± 95% confidence intervals with log-transformed respective opsin template superimposed (F) (Methods). Heatmaps (E) are time-inverted to facilitate comparison to summary plots (F); grayscale bars are in z scores. Darker shades indicate a drop in calcium relative to baseline, indicative of a cone’s “intrinsic” light response, while lighter shades indicate a rise in calcium, indicative of sign-inverted inputs from the outer retinal network (see Fig. 2). |