
FIG 3
- ID
- ZDB-FIG-230302-9
- Publication
- Boland et al., 2022 - Repurposing Tamoxifen as Potential Host-Directed Therapeutic for Tuberculosis
- Other Figures
- All Figure Page
- Back to All Figure Page
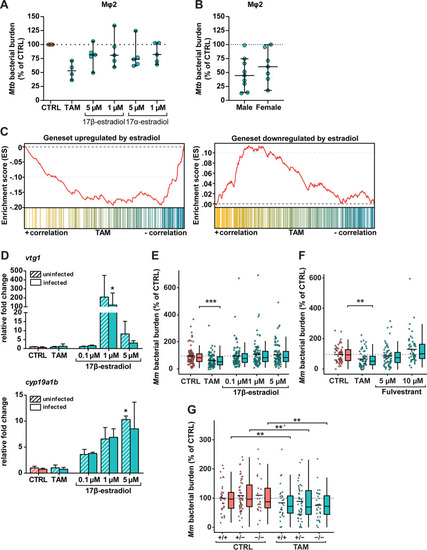
The host-directed effect of tamoxifen is independent of ER signaling. (A) CFU assay of Mφ2 macrophages infected with H37Rv-Mtb and treated with tamoxifen (10 μM), 17β-estradiol (1 or 5 μM), 17α-estradiol (1 or 5 μM), or control (DMSO at equal volume) for 24 h. Each dot represents a single donor (4 to 5 donors were tested) and depicts the mean of 3 replicates normalized to control. The dotted line indicates the control set at 100%, and median values + 95% confidence intervals are shown for every condition. Statistical significance was tested using a Wilcoxon matched-pairs signed-rank test with post hoc Benjamini-Hochberg correction. (B) CFU assay of Mφ2 macrophages infected with H37Rv-Mtb and treated with 10 μM tamoxifen for 24 h separated for donor sex. The graph includes data points from A and Fig. 1A. Each dot represents a single donor (9 in the male group and 7 in the female group) and depicts the mean of 3 replicates normalized to control. The dotted line indicates the control set at 100%, and median values + 95% confidence intervals are shown for every condition. Statistical significance was tested using a Mann-Whitney U test. (C) GSEA enrichment plots of downregulated (left) and upregulated (right) estradiol-responding genes in zebrafish larvae treated with 5 μM tamoxifen for 2 days (3 dpf). All estradiol-responding genes in the tamoxifen-treated larval transcriptome were ranked according to their statistical significance and direction of regulation from left (most significant, upregulated in yellow) to right (most significant, downregulated in blue). Each column depicts the position of an individual gene belonging to the gene set of estradiol-responding genes in the ranked list. (D) Noninfected and mWasabi-expressing Mm-infected zebrafish larvae were treated with 5 μM tamoxifen, increasing doses of the ER agonist 17β-estradiol (0.1, 1, and 5 μM), or control (DMSO at 0.05% [vol/vol]) starting at 1 hpi. Transcript levels of two β-estradiol-responsive genes, vtg1 (top) and cyp19a1b (bottom) were determined by qPCR analysis at 4 dpi. Data were normalized to the expression of the housekeeping gene TATA box binding protein (tbp), and data of 3 biological replicates were combined (n = 10 larvae per replicate). Each bar depicts the average fold change (FC) of transcript levels relative to noninfected or infected control-treated zebrafish larvae, and the error bar indicates standard error of the mean (SEM). Statistical analysis was performed using a Kruskal-Wallis test with Dunn’s multiple-comparison test. The effect of treatment compared to control was analyzed within the noninfected and infected groups separately. (E) Bacterial burden assay of mWasabi-expressing Mm-infected zebrafish larvae treated as in D. Treatment was started at 1 hpi, and larvae were anesthetized at 4 dpi for imaging. Bacterial burden was normalized to the control, and data of 3 experimental repeats were combined (n = 93 to 95 per group). Each dot represents a single larva. Box plots with 95% confidence intervals are shown. The black line in the box plots indicates the group median, while the black line in the dot plot indicates the group mean. The dotted line indicates control mean set at 100%. Statistical analysis was performed using a Kruskal-Wallis test with Dunn’s multiple-comparison test. (F) Bacterial burden assay of mWasabi-expressing Mm-infected zebrafish larvae treated with of 5 μM tamoxifen, increasing doses of the ER antagonist fulvestrant (5 and 10 μM), or control (DMSO at 0.05% [vol/vol]). Treatment was started at 1 hpi, and larvae were anesthetized at 4 dpi for imaging. Bacterial burden was normalized to the control, and data from 2 experimental repeats were combined (n = 53 to 63 per group). Each dot represents a single larva. Box plots with 95% confidence intervals are shown. The black line in the box plots indicates the group median, while the black line in the dot plot indicates the group mean. The dotted line indicates the control mean set at 100%. Statistical analysis was performed using a Kruskal-Wallis test with Dunn’s multiple-comparison test. (G) Bacterial burden assay of mWasabi-expressing Mm-infected esr2b+/+, esr2b+/−, and esr2b−/− zebrafish larvae treated with 5 μM tamoxifen or control (DMSO at equal volume). Treatment was started at 1 hpi, and larvae were anesthetized at 4 dpi for imaging. Bacterial burden was normalized to the control, and data from 2 experimental repeats were combined (n = 25 to 55 per group). Each dot represents a single larva. Box plots with 95% confidence intervals are shown. The black line in the box plots indicates the group median, while the black line in the dot plot indicates the group mean. The dotted line indicates the mean of control-treated esr2b+/+ zebrafish larvae set at 100%. Statistical significance of the difference between the control and tamoxifen-treated groups was determined using a two-way ANOVA; *, P < 0.05; **, P < 0.01; ***, P < 0.001. |