
- Title
-
Repurposing Tamoxifen as Potential Host-Directed Therapeutic for Tuberculosis
- Authors
- Boland, R., Heemskerk, M.T., Forn-Cuní, G., Korbee, C.J., Walburg, K.V., Esselink, J.J., Carvalho Dos Santos, C., de Waal, A.M., van der Hoeven, D.C.M., van der Sar, E., de Ries, A.S., Xie, J., Spaink, H.P., van der Vaart, M., Haks, M.C., Meijer, A.H., Ottenhoff, T.H.M.
- Source
- Full text @ MBio

In vitro identification of tamoxifen as a novel repurposed host-directed therapeutic. (A and B) CFU assay of Mφ1 (left) and Mφ2 (right) macrophages infected with H37Rv-Mtb (A) or Stm (B) and treated with 10 μM tamoxifen (TAM) or control (CTRL; DMSO at equal volume) for 24 h. Each dot represents a single donor (8 and 9 donors for Mφ1 and Mφ2 macrophages, respectively, in A, and 6 donors in B) and depicts the mean of 3 or 4 replicates. Statistical significance was tested using by Wilcoxon matched-pairs signed-rank test. (C and D) H37Rv-Mtb growth (C) or Stm growth (D) in liquid culture during treatment with 10, 20, 40, or 80 μM tamoxifen or control (DMSO at equal volume [10 μM is shown]) up to the assay endpoint day 14 (C) or overnight (D). Rifampicin (20 μg/mL) (C) or gentamicin (50 μg/mL) (D) was used as a positive control for growth inhibition. Each line depicts the mean ± standard deviation of three replicates. The experiment shown is a representative of two (C) or three (D) independent experiments. Statistical significance of treatment versus control treatment was tested by two-way ANOVA with Dunnett’s multiple-comparison test. (E) CFU assay of Mφ2 macrophages infected with MDR-Mtb strain Dutch outbreak 2003-1128 (left) or Mtb Beijing strain 16319 (right) and treated with 10 μM tamoxifen or control (DMSO at equal volume) for 24 h. Each dot represents a single donor (6 donors in total) and depicts the mean of three replicates. Statistical significance was tested using a ratio paired t test. (F and G) CFU assay of Mφ2 macrophages infected with H37Rv-Mtb and treated for 24 h with 10 μM tamoxifen or control (DMSO at equal volume) in combination with suboptimal doses of 0.05 μg/mL rifampicin (F) or 0.4 μg/mL isoniazid (G). Each bar depicts the mean ± standard deviation of three replicates from a representative donor (out of 4 donors tested in F and 3 donors in G) expressed as a percentage of the control treatment in the absence of antibiotics. Bars with solid colors represent tamoxifen or control treatment only, and bars with patterns represent the combination with antibiotic. Statistical significance was tested by two-way ANOVA with Tukey’s multiple-comparison test comparing tamoxifen treatment (in the absence or presence of antibiotics) to the corresponding control treatment. (H) LDH release assay of Mφ1 (left) and Mφ2 (right) macrophages infected with H37Rv-Mtb and treated with 10 μM tamoxifen or control (DMSO at equal volume) for 24 h. Each dot represents a single donor (5 and 6 donors for Mφ1 and Mφ2 macrophages, respectively) and depicts the mean of three replicates. Dotted lines indicate the control set at 100%, and median values + 95% confidence intervals are shown for every condition. Statistical significance was tested using a ratio paired t test; *, P < 0.05; **, P < 0.01; ***, P < 0.001; ****, P < 0.0001. |

In vivo validation of tamoxifen as an HDT. (A) Bacterial burden assay of mWasabi-expressing Mm-infected zebrafish larvae treated with increasing doses of tamoxifen (2.5, 5, and 10 μM) or control (DMSO at 0.1% [vol/vol]). Treatment was started at 1 hpi, and larvae were anesthetized at 4 dpi for imaging. Representative stereo fluorescent images of whole larvae infected with mWasabi-expressing Mm are shown. Magenta shows Mm; scale bar, 1 mm. (B) Quantification of bacterial burden shown in A. Bacterial burden was normalized to the mean of the control group (set at 100% and indicated with the dotted line). Data from 4 experimental repeats were combined (n = 132 to 139 per group). Each dot represents a single larva. Box plots with 95% confidence intervals are shown. The black line in the box plots indicates the group median, while the black line in the dot plot indicates the group mean. Statistical analysis was performed using a Kruskal-Wallis test with Dunn’s multiple-comparison test. (C) Bacterial burden assay of mWasabi-expressing Mm-infected zebrafish larvae treated with 5 and 10 μM tamoxifen or control (DMSO at 0.1% [vol/vol]). Treatment was started at 1 hpi, and larvae were anesthetized at 1, 2, 3, and 4 dpi for imaging. Bacterial burden was normalized to the control (DMSO at 1 dpi), and data of two experimental repeats were combined (n = 65 to 70 per group). All larvae in the 10 μM group died between 3 and 4 dpi. Box plots with 95% confidence intervals are shown. The black line in the box plots indicates the group median, while the dotted line indicates the group mean. Statistical analysis was performed between treatment groups per time point using a Kruskal-Wallis test with Dunn’s multiple-comparison test. (D) Mm growth in liquid culture during treatment with 5 or 10 μM tamoxifen or control (DMSO at equal volume) up to the assay endpoint, day 2. Lines depict mean ± standard deviation of two experiments. Statistical significance of treatment versus control treatment was tested using a two-way ANOVA with Dunnett’s multiple-comparison test; *, P < 0.05; **, P < 0.01; ***, P < 0.001; ****, P < 0.0001. |
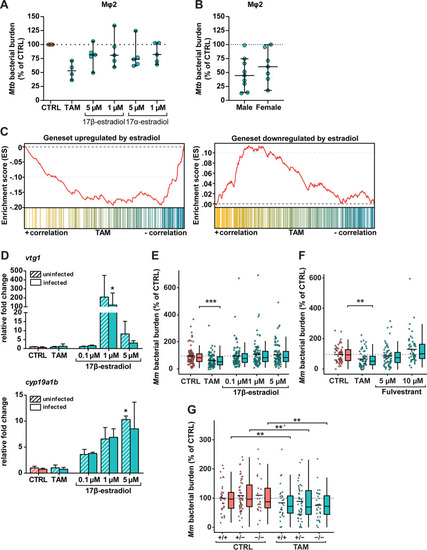
The host-directed effect of tamoxifen is independent of ER signaling. (A) CFU assay of Mφ2 macrophages infected with H37Rv-Mtb and treated with tamoxifen (10 μM), 17β-estradiol (1 or 5 μM), 17α-estradiol (1 or 5 μM), or control (DMSO at equal volume) for 24 h. Each dot represents a single donor (4 to 5 donors were tested) and depicts the mean of 3 replicates normalized to control. The dotted line indicates the control set at 100%, and median values + 95% confidence intervals are shown for every condition. Statistical significance was tested using a Wilcoxon matched-pairs signed-rank test with post hoc Benjamini-Hochberg correction. (B) CFU assay of Mφ2 macrophages infected with H37Rv-Mtb and treated with 10 μM tamoxifen for 24 h separated for donor sex. The graph includes data points from A and Fig. 1A. Each dot represents a single donor (9 in the male group and 7 in the female group) and depicts the mean of 3 replicates normalized to control. The dotted line indicates the control set at 100%, and median values + 95% confidence intervals are shown for every condition. Statistical significance was tested using a Mann-Whitney U test. (C) GSEA enrichment plots of downregulated (left) and upregulated (right) estradiol-responding genes in zebrafish larvae treated with 5 μM tamoxifen for 2 days (3 dpf). All estradiol-responding genes in the tamoxifen-treated larval transcriptome were ranked according to their statistical significance and direction of regulation from left (most significant, upregulated in yellow) to right (most significant, downregulated in blue). Each column depicts the position of an individual gene belonging to the gene set of estradiol-responding genes in the ranked list. (D) Noninfected and mWasabi-expressing Mm-infected zebrafish larvae were treated with 5 μM tamoxifen, increasing doses of the ER agonist 17β-estradiol (0.1, 1, and 5 μM), or control (DMSO at 0.05% [vol/vol]) starting at 1 hpi. Transcript levels of two β-estradiol-responsive genes, vtg1 (top) and cyp19a1b (bottom) were determined by qPCR analysis at 4 dpi. Data were normalized to the expression of the housekeeping gene TATA box binding protein (tbp), and data of 3 biological replicates were combined (n = 10 larvae per replicate). Each bar depicts the average fold change (FC) of transcript levels relative to noninfected or infected control-treated zebrafish larvae, and the error bar indicates standard error of the mean (SEM). Statistical analysis was performed using a Kruskal-Wallis test with Dunn’s multiple-comparison test. The effect of treatment compared to control was analyzed within the noninfected and infected groups separately. (E) Bacterial burden assay of mWasabi-expressing Mm-infected zebrafish larvae treated as in D. Treatment was started at 1 hpi, and larvae were anesthetized at 4 dpi for imaging. Bacterial burden was normalized to the control, and data of 3 experimental repeats were combined (n = 93 to 95 per group). Each dot represents a single larva. Box plots with 95% confidence intervals are shown. The black line in the box plots indicates the group median, while the black line in the dot plot indicates the group mean. The dotted line indicates control mean set at 100%. Statistical analysis was performed using a Kruskal-Wallis test with Dunn’s multiple-comparison test. (F) Bacterial burden assay of mWasabi-expressing Mm-infected zebrafish larvae treated with of 5 μM tamoxifen, increasing doses of the ER antagonist fulvestrant (5 and 10 μM), or control (DMSO at 0.05% [vol/vol]). Treatment was started at 1 hpi, and larvae were anesthetized at 4 dpi for imaging. Bacterial burden was normalized to the control, and data from 2 experimental repeats were combined (n = 53 to 63 per group). Each dot represents a single larva. Box plots with 95% confidence intervals are shown. The black line in the box plots indicates the group median, while the black line in the dot plot indicates the group mean. The dotted line indicates the control mean set at 100%. Statistical analysis was performed using a Kruskal-Wallis test with Dunn’s multiple-comparison test. (G) Bacterial burden assay of mWasabi-expressing Mm-infected esr2b+/+, esr2b+/−, and esr2b−/− zebrafish larvae treated with 5 μM tamoxifen or control (DMSO at equal volume). Treatment was started at 1 hpi, and larvae were anesthetized at 4 dpi for imaging. Bacterial burden was normalized to the control, and data from 2 experimental repeats were combined (n = 25 to 55 per group). Each dot represents a single larva. Box plots with 95% confidence intervals are shown. The black line in the box plots indicates the group median, while the black line in the dot plot indicates the group mean. The dotted line indicates the mean of control-treated esr2b+/+ zebrafish larvae set at 100%. Statistical significance of the difference between the control and tamoxifen-treated groups was determined using a two-way ANOVA; *, P < 0.05; **, P < 0.01; ***, P < 0.001. |

Tamoxifen treatment modulates autophagy in infected human macrophages and zebrafish. (A) Confocal microscopy of DsRed-expressing H37Rv-Mtb-infected Mφ2 macrophages treated with 10 μM tamoxifen or control (DMSO at equal volume) for 4 h. Thirty minutes before the experimental endpoint, cells were incubated with Cyto-ID to stain for autophagy-related vesicles, fixed with 1% paraformaldehyde, and counterstained for the nucleus using Hoechst 33342. In the representative images, yellow shows the nucleus, magenta shows Mtb, and cyan shows autophagy-related vesicles; scale bar, 5 μm. (B) Quantification of Cyto-ID signals in A. Cyto-ID-positive area (left) and Mtb colocalization with Cyto-ID-positive vesicles (right) are displayed. Each dot displays the mean of 3 or 4 replicates and represents a single donor (4 donors in total), with the median indicated by colored bars. Statistical significance was tested using a Wilcoxon matched-pairs signed-rank test; a.u., arbitrary units. (C) Confocal microscopy of transgenic GFP-Lc3 zebrafish larvae treated with 5 μM tamoxifen or control (DMSO at equal volume). Treatment was started at 3 dpf, and larvae were fixed with 4% paraformaldehyde at 4 dpf for imaging. Representative max projection images of GFP-Lc3-positive vesicles in the indicated region of imaging (ROI) in the tail fin are shown. Cyan shows GFP-Lc3-positive vesicles; scale bar, 10 μm. (D) Quantification of GFP-Lc3 structures shown in C. Data were normalized to the control, and data from 2 experimental repeats were combined (n = 16 to 18 per group). Each dot represents a single larva. Box plots with 95% confidence intervals are shown. The black line in the box plots indicates the group median, while the black line in the dot plot indicates the group mean. Statistical analysis was performed using a Mann-Whitney test. (E) Confocal microscopy of mCherry-expressing Mm-infected transgenic GFP-Lc3 zebrafish larvae treated with 5 μM tamoxifen or control (DMSO at equal volume). Treatment was started at 1 hpi, and at 2 dpi, larvae were fixed with 4% paraformaldehyde for imaging. Representative max projection images of the ROI in the caudal hematopoietic tissue (CHT) region are shown. Cyan shows GFP-Lc3-positive vesicles, and magenta shows Mm; scale bar, 50 μm. (F and G) Enlargement of areas indicated in E. Cyan shows GFP-Lc3-positive vesicles, and magenta shows Mm. Arrowheads indicate GFP-Lc3-positive Mm clusters; scale bar, 10 μm. (H) Quantification of GFP-Lc3-positive Mm clusters in the CHT region shown in E normalized to the control (n = 8 per group). Each dot represents a single larva. Box plots with 95% confidence intervals are shown. The black line in the box plots indicates the group median, while the black line in the dot plot indicates the group mean. Statistical analysis was performed using a Mann-Whitney test; ****, P < 0.0001; ns, not significant. |

Tamoxifen treatment alters lysosomal function and increases mycobacterial lysosomal localization in vitro and in vivo. (A) Confocal microscopy of DsRed-expressing H37Rv-Mtb-infected Mφ2 macrophages treated with 10 μM tamoxifen or DMSO at equal volume for 4 h. Thirty minutes before the experimental endpoint, cells were incubated with LysoTracker Deep Red to stain for acidic vesicles, fixed with 1% paraformaldehyde, and counterstained for the nucleus using Hoechst 33342. In the representative images, yellow shows the nucleus, magenta shows Mtb, and cyan shows acidic vesicles; scale bar, 5 μm. (B) Quantification of LysoTracker signal in A. Lysotracker-positive area (left) and Mtb colocalization with Lysotracker-positive vesicles (right) are shown. Each dot displays the mean of 3 or 4 replicates and represents a single donor (4 donors in total), with the median indicated by colored bars. Statistical significance was tested using a paired t test; a.u., arbitrary units. (C) Confocal microscopy of DsRed-expressing Mtb-infected Mφ2 macrophages treated with 10 μM tamoxifen or DMSO at equal volume for 4 h. Cells were fixed at the experimental endpoint, permeabilized using 0.1% Triton-X, stained for TFEB, and counterstained for the nucleus and F-actin using Hoechst 33342 and phalloidin, respectively; scale bar, 5 mm. (D) Quantification of nuclear TFEB intensity in C. Each dot displays the log2 (FC) of median nuclear TFEB intensity per donor normalized to DMSO (5 donors in total); 95% confidence intervals are indicated. Statistical significance was tested using a paired t test. (E) CFU assay of Mφ2 macrophages infected with H37Rv-Mtb and treated for 24 h with 10 μM tamoxifen, 10 μM tamoxifen in combination with 10 nM bafilomycin (BAF), or control (DMSO at equal volume). Each dot represents a single donor (6 donors in total) and depicts the mean of 3 replicates. Statistical significance was tested using an RM one-way ANOVA with Holm-Sidak multiple-testing correction. (F) Confocal microscopy maximum projection of the indicated ROI in zebrafish larvae treated with 5 μM tamoxifen or control (DMSO at equal volume). Treatment was started at 31 hpf, and at 3 dpf, larvae were immersed in 5 μM LysoTracker Red DND-99 for 1 h and subsequently anesthetized for imaging. Cyan shows acidic vesicles; scale bar, 10 μm. (G) Confocal microscopy maximum projection of mWasabi-expressing Mm-infected zebrafish larvae treated with 5 μM tamoxifen or control (DMSO at equal volume). Treatment was started at 1 hpi, and at 2 dpi, larvae were immersed in 5 μM LysoTracker Red DND-99 for 1 h and subsequently anesthetized for imaging. Representative maximum projection images of LysoTracker-positive Mm clusters in the CHT region are shown. Cyan shows acidic vesicles, and magenta shows Mm; scale bar, 50 μm. (H and I) Enlargement of areas indicated in G. Cyan shows acidic vesicles, and magenta shows Mm. Arrowheads indicate LysoTracker-positive Mm clusters; scale bar, 10 μm. (J) Quantification of LysoTracker-positive Mm clusters normalized to the control. Data from 3 experimental repeats were combined (n = 18 per group). Each dot represents a single larva. Box plots with 95% confidence intervals are shown. The black line in the box plots indicates the group median, while the black line in the dot plot indicates the group mean. Statistical analysis was performed using a Mann-Whitney test; *, P < 0.05. |