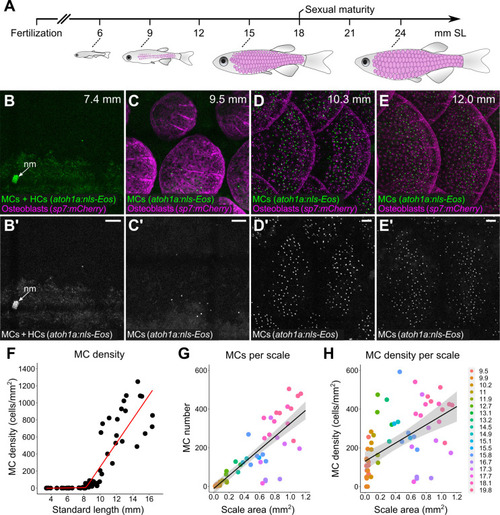
(A) Abbreviated zebrafish developmental timeline relative to standard length (SL) in millimeters. Developing scales are drawn in magenta below the approximate corresponding stage. (B–E) Representative lateral confocal micrographs of MCs and osteoblasts along the trunk at the indicated stages. Note that MCs increase in number and density as scale-forming osteoblasts develop below the epidermis. nm, neuromast of the posterior lateral line. (F) Quantification of MC density according to SL. Each dot represents an individual fish. Data represent n=81 scales from N=52 fish. Line indicates segmented linear regression (breakpoint = 8.27 mm SL). (G and H) Quantification of the number (G) or density (H) of MCs relative to scale area. Each dot represents an individual scale. Data represent n=62 scales from N=18 fish. Dot colors represent animal SL as indicated in the legend. Shading indicates a 95% CI around the linear regression lines in G and H. Correlation coefficients (R2): 0.08 (F, slope 1), 0.68 (F, slope 2), 0.73 (G), and 0.31 (H). F-statistics: 3.5 (F, slope 1), 83.9 (F, slope 2),164.6 (G), and 28.31 (H). p-values: 0.07 (F, slope 1), <0.05 (F, slope 2), and <0.05 (G and H). Scale bars: 50 μm.