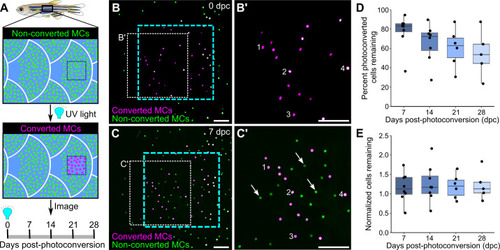
(A) Illustration of the photoconversion experiment showing the epidermis (blue), non-converted MCs (green), and converted MCs (magenta) after exposure of a region of the scale epidermis to UV light. (B and C) Representative images of MCs labeled by Tg(atoh1a:nls-Eos) at 0 (B) or 7 (C) days post-conversion (dpc) from a single adult. Cyan dotted box indicates the photoconverted region. White dotted box indicates the area magnified in B’ and C’. (B’ and C) Numbers label examples of individual cells present at 0 and 7 dpc. Arrows indicate examples of newly added cells, which appear green due to the presence of non-converted nls-Eos (green) and absence of converted nls-Eos (magenta). (D and E) Boxplots of the percentage of photoconverted MCs remaining compared to 0 dpc (D) and the total number of MCs (converted+non-converted) present at each day compared to 0 dpc (E). Each dot represents an individual fish. N=5–8 fish (24–32 mm standard length [SL]). Scale bars: 50 μm.