
Fig. 2
- ID
- ZDB-FIG-230116-15
- Publication
- Juan et al., 2023 - Multiple pkd and piezo gene family members are required for atrioventricular valve formation
- Other Figures
- All Figure Page
- Back to All Figure Page
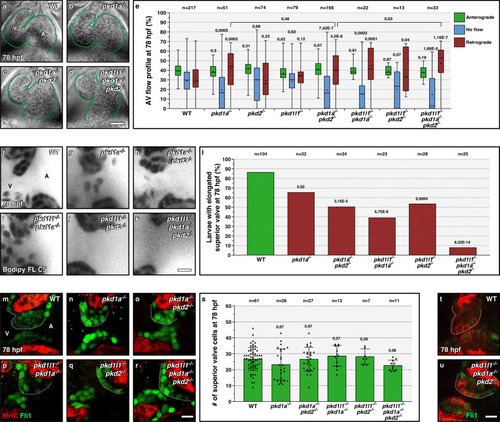
pkd1a, pkd2, and pkd1l1 cooperate during atrioventricular valve development.
a–d Brightfield images of 78 hpf wild-type (a), pkd1a mutant (b), pkd1a; pkd2 double mutant (c), and pkd triple mutant (d) hearts; one time point of a spinning disc movie at atrial diastole; green lines outline the heart. e AV flow profile of 78 hpf wild-type, pkd1a mutant, pkd2 mutant, pkd1l1 mutant, pkd double mutant, and pkd triple mutant larvae; average profile of three cardiac cycles per zebrafish. f–k Confocal imaging of 78 hpf wild-type (f), pkd1a mutant (g), pkd double mutant (h–j), and pkd triple mutant (k) hearts stained with Bodipy FL C5-Ceramide; AV canal magnified images. l Superior AV valve elongation of 78 hpf wild-type, pkd1a mutant, pkd double mutant, and pkd triple mutant hearts. m–r Confocal imaging of 78 hpf wild-type (m), pkd1a mutant (n), pkd double mutant (o–q), and pkd triple mutant (r) hearts immunostained for MHC and Fli1; AV canal magnified images. s Superior AV valve cell number in 78 hpf wild types, pkd1a mutants, pkd double mutants, and pkd triple mutants. t, u Confocal imaging of 78 hpf wild-type (t) and pkd triple mutant (u) hearts immunostained for Alcama and Fli1; 10/10 of the wild-type and 9/9 of the pkd triple mutant larvae display luminal and abluminal superior valve cells; AV canal magnified images. Hearts imaged in ventral view, anterior to the top, ventricle (V) on the left and atrium (A) on the right. The center of the box-and-whisker plot represents the median; each of the box-and-whiskers represents a quartile; “+” represents the mean in e. The center of the error bar represents the mean in l, s. Error bars indicate s.d in s. P values were calculated using a two-sided Student’s t-test in e, s; a two-sided Fisher’s exact test in l; and are relative to wild type except when a horizontal bar is used. Scale bars: 50 µm in a–d; 10 µm in f–k, m–r, t, u. Source data are provided as a Source Data file. |
| Fish: | |
|---|---|
| Observed In: | |
| Stage: | Protruding-mouth |