
- Title
-
Multiple pkd and piezo gene family members are required for atrioventricular valve formation
- Authors
- Juan, T., Ribeiro da Silva, A., Cardoso, B., Lim, S., Charteau, V., Stainier, D.Y.R.
- Source
- Full text @ Nat. Commun.
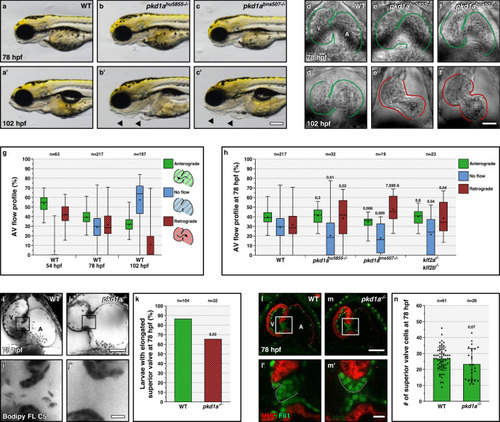
pkd1a is required for atrioventricular valve development.
a–c′ Wild-type (a-a′) like morphology of pkd1ahu5855 (b-b′) and pkd1abns507 (c-c′) mutants at 78 but not 102 hpf; arrows point to craniofacial defects and pericardial edema. d–f′ Brightfield images of 78 and 102 hpf wild-type (d-d′), pkd1ahu5855 mutant (e-e′), and pkd1abns507 mutant (f-f′) hearts; one time point of a spinning disc movie at atrial diastole; green and red lines outline the heart. g AV flow profile of 54, 78, and 102 hpf wild-type zebrafish; average profile of three cardiac cycles per zebrafish. h AV flow profile of 78 hpf wild-type, pkd1ahu5855 mutant, pkd1abns507 mutant, and klf2a; klf2b double mutant larvae; average profile of three cardiac cycles per zebrafish. i–j′ Confocal imaging of 78 hpf wild-type (i-i′) and pkd1a mutant (j-j′) hearts stained with Bodipy FL C5-Ceramide; i′, j′ are AV canal magnified images of i, j. k Superior AV valve elongation of 78 hpf wild-type and pkd1a mutant larvae. l–m′ Confocal imaging of 78 hpf wild-type (l-l′) and pkd1a mutant (m-m′) hearts immunostained for MHC and Fli1; l′,m′ are AV canal magnified images of l,l. n Superior AV valve cell number in 78 hpf wild types and pkd1a mutants. Hearts imaged in ventral view, anterior to the top, ventricle (V) on the left, and atrium (A) on the right. The center of the box-and-whisker plots represents the median; each of the box-and-whiskers represents a quartile; “+” represents the mean in g, h. The center of the error bar represents the mean in k, n. Error bars indicate s.d in n. P values were calculated using a two-sided Student’s t-test in g, h, n; a two-sided Fisher’s exact test in k; and are relative to wild type. Scale bars: 200 µm in a–c′; 50 µm in d–f′, i, j, l, m; 10 µm in i′, j′, l′, m′. Source data are provided as a Source Data file. |
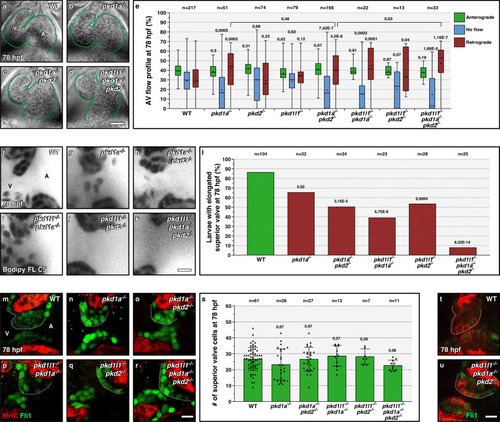
pkd1a, pkd2, and pkd1l1 cooperate during atrioventricular valve development.
a–d Brightfield images of 78 hpf wild-type (a), pkd1a mutant (b), pkd1a; pkd2 double mutant (c), and pkd triple mutant (d) hearts; one time point of a spinning disc movie at atrial diastole; green lines outline the heart. e AV flow profile of 78 hpf wild-type, pkd1a mutant, pkd2 mutant, pkd1l1 mutant, pkd double mutant, and pkd triple mutant larvae; average profile of three cardiac cycles per zebrafish. f–k Confocal imaging of 78 hpf wild-type (f), pkd1a mutant (g), pkd double mutant (h–j), and pkd triple mutant (k) hearts stained with Bodipy FL C5-Ceramide; AV canal magnified images. l Superior AV valve elongation of 78 hpf wild-type, pkd1a mutant, pkd double mutant, and pkd triple mutant hearts. m–r Confocal imaging of 78 hpf wild-type (m), pkd1a mutant (n), pkd double mutant (o–q), and pkd triple mutant (r) hearts immunostained for MHC and Fli1; AV canal magnified images. s Superior AV valve cell number in 78 hpf wild types, pkd1a mutants, pkd double mutants, and pkd triple mutants. t, u Confocal imaging of 78 hpf wild-type (t) and pkd triple mutant (u) hearts immunostained for Alcama and Fli1; 10/10 of the wild-type and 9/9 of the pkd triple mutant larvae display luminal and abluminal superior valve cells; AV canal magnified images. Hearts imaged in ventral view, anterior to the top, ventricle (V) on the left and atrium (A) on the right. The center of the box-and-whisker plot represents the median; each of the box-and-whiskers represents a quartile; “+” represents the mean in e. The center of the error bar represents the mean in l, s. Error bars indicate s.d in s. P values were calculated using a two-sided Student’s t-test in e, s; a two-sided Fisher’s exact test in l; and are relative to wild type except when a horizontal bar is used. Scale bars: 50 µm in a–d; 10 µm in f–k, m–r, t, u. Source data are provided as a Source Data file. |
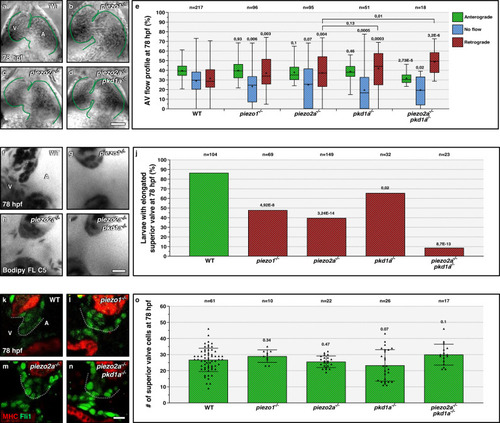
piezo1 and piezo2a promote atrioventricular valve development.
a–d Brightfield images of 78 hpf wild-type (a), piezo1 mutant (b), piezo2a mutant (c), and piezo2a; pkd1a double mutant (d) hearts; one time point of a spinning disc movie at atrial diastole; green lines outline the heart. e AV flow profile of 78 hpf wild-type, piezo1 mutant, pkd1a mutant, piezo2a mutant, and piezo2a; pkd1a double mutant larvae; average profile of three cardiac cycles per zebrafish. f–i Confocal imaging of 78 hpf wild-type (f), piezo1 mutant (g), piezo2a mutant (h), and piezo2a; pkd1a double mutant (i) hearts stained with Bodipy FL C5-Ceramide; AV canal magnified images. j Superior AV valve elongation of 78 hpf wild types, piezo1 mutants, pkd1a mutants, piezo2a mutants, and piezo2a; pkd1a double mutants. k–n Confocal imaging of 78 hpf wild-type (k), piezo1 mutant (l), piezo2a mutant (m), and piezo2a; pkd1a double mutant (n) hearts immunostained for MHC and Fli1; AV canal magnified images; ventral views, anterior to the top, ventricle (V) on the left and atrium (A) on the right. o Superior AV valve cell number in 78 hpf wild types, piezo1 mutants, pkd1a mutants, piezo2a mutants, and piezo2a; pkd1a double mutants. Hearts imaged in ventral views, anterior to the top, ventricle (V) on the left, and atrium (A) on the right. The center of the box-and-whisker plot represents the median; each of the box-and-whiskers represents a quartile; “+” represents the mean in e. The center of the error bar represents the mean in j, o. Error bars indicate s.d in o. P values were calculated using a two-sided Student’s t-test in e, o; a two-sided Fisher’s exact test in j; and are relative to wild type except when a horizontal bar is used. Scale bars: 50 µm in a–d; 10 µm in f–i, k–n. Source data are provided as a Source Data file. |
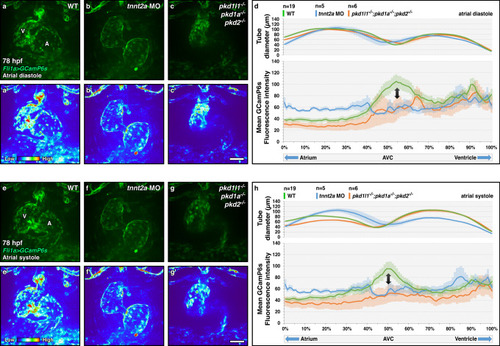
Control of calcium levels in the atrioventricular canal by Pkd members.
a–c, e–g Confocal imaging of 78 hpf fli1a:Gal4FF; UAS:GCamP6s wild-type (a, a′, e, e′), tnnt2a morphant (b, b, f, f′) and pkd triple mutant (c, c′, g, g′) hearts during atrial diastole (a–c′) and systole (e–g′); maximum projection of 4D-assembled spinning disc movies. d, h Diameter and endocardial calcium levels along the contracting heart tube in 78 hpf wild-type, tnnt2a morphant, and pkd triple mutant larvae during atrial diastole (d) and systole (h); arrows point to the AV canal calcium peak. Hearts imaged in ventral view, anterior to the top, ventricle (V) on the left, and atrium (A) on the right. Error bars indicate SEM. Scale bars: 50 µm. Source data are provided as a Source Data file. |
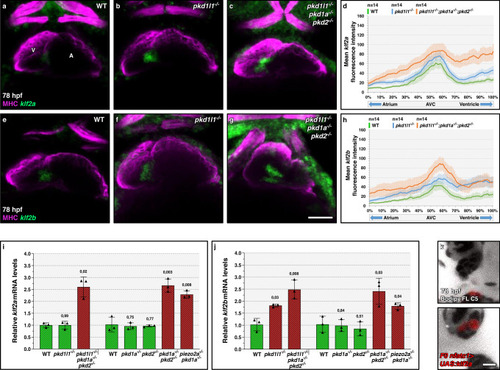
Pkd and Piezo members repress klf2 expression in the atrioventricular canal.
a–c, e–g Confocal projections of 78 hpf wild-type (a, e), pkd1l1 mutant (b, f), and pkd triple mutant (c, h) hearts stained for MHC, and klf2a (a–c), or klf2b (e–g) expression; ventral views, anterior to the top, ventricle (V) on the left, and atrium (A) on the right. d, h klf2a (d) and klf2b (h) mean fluorescence intensity along the heart tube in 78 hpf wild-type, pkd1l1 mutant, and pkd triple mutant larvae. i, j Relative mRNA levels of klf2a (i) and klf2b (j) in 78 hpf wild-type, pkd1l1 mutant, pkd1a mutant, pkd2 mutant, pkd1a; pkd2 double mutant, pkd triple mutant, and piezo2a; pkd1a double mutant dissected hearts; n = 3 biologically independent samples; Ct values are listed in Supplementary Data 1. k, l Confocal imaging of 78 hpf nfatc1:Gal4FF larvae injected at the one-cell stage with a plasmid encoding a UAS:klf2a-p2a-dTomato, presenting negative (k) or positive (l) superior valve cells, and stained with Bodipy FL C5-Ceramide; 32/34 of the negative larvae and 5/13 of the positive larvae display an elongated superior valve; AV canal magnified images. Hearts imaged in ventral view, anterior to the top, ventricle (V) on the left, and atrium (A) on the right. The center of the error bar represents the mean in i, j. Error bars indicate SEM in d, h; s.d. in i, j. P values were calculated using a two-sided Student’s t-test in i, j and are relative to the wild type. Scale bars: 50 µm in a–c, e–g; 10 µm in k, l. Source data are provided as a Source Data file. |
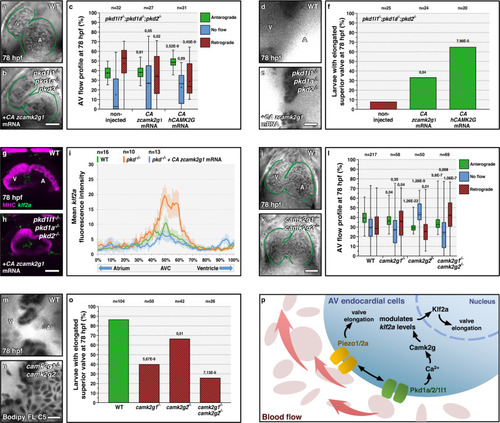
Pkd function in atrioventricular valve development is mediated by Camk2g.
a, b Brightfield images of 78 hpf hearts from non-injected pkd triple mutant (a) or injected at the one-cell stage with mRNA encoding a CA zCamk2g1 (b). c AV flow profile of 78 hpf pkd triple mutant larvae non-injected or injected at the one-cell stage with mRNA encoding CA zCamk2g1 or CA hCAMK2G. d, e Confocal imaging of hearts from 78 hpf non-injected pkd triple mutant (d) or injected at the one-cell stage with mRNA encoding CA zCamk2g1 (e) and stained with Bodipy. f Superior AV valve elongation of 78 hpf non-injected pkd triple mutants or injected at the one-cell stage with mRNA encoding CA zCamk2g1 or hCAMK2G. g, h Confocal projections of hearts from 78 hpf wild-type (g) and pkd triple mutant injected at the one-cell stage with mRNA encoding CA zCamk2g1 (h), stained for MHC and klf2a expression. i klf2a fluorescence intensity along the heart tube in 78 hpf wild types and pkd triple mutants non-injected or injected at the one-cell stage with mRNA encoding CA zCamk2g1. j, k Brightfield images of 78 hpf wild-type (j) and camk2g1/2 double mutant (k) hearts. l AV flow profile of 78 hpf wild-type, camk2g1 mutant, camk2g2 mutant, and camk2g1/2 double mutant larvae. m, n Confocal imaging of 78 hpf wild-type (m) and camk2g1/2 double mutant (n) hearts stained with Bodipy. o Superior AV valve elongation of 78 hpf wild types and camk2g1/2 mutants. p Model summarizing the mechanosensory control of AV valve elongation. Hearts are oriented, annotated, and imaged as in Fig. 1. The box-and-whisker plots in c, l represent the same type of data as in Fig. 1g. The center of the bar represents the mean in f, o. P values are calculated using a two-sided Student’s t-test in c, l; a Fisher’s exact test in f, o; and are relative to wild type. Error bars indicate SEM in i. Scale bars: 50 µm in a, b, g, h, j, k; 10 µm in d, e, m, n. Source data are provided as a Source Data file. |