
Fig. 4
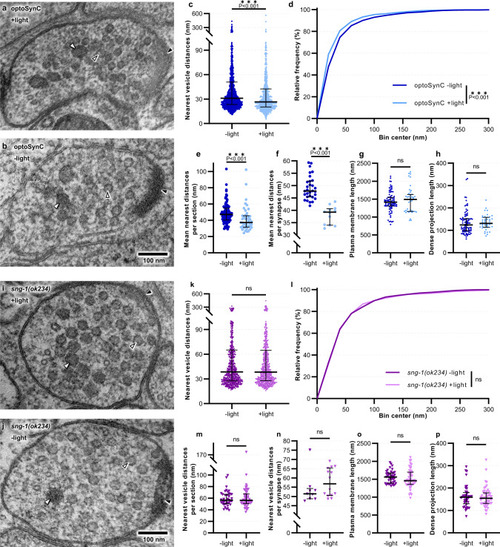
optoSynC activation causes clustering of SVs at the ultrastructural level.
a, b Transmission electron micrographs of representative cholinergic synapses from animals illuminated for 5 s (a, +light) with blue light (470 nm, 0.1 mW/mm²), or kept in darkness (b, −light) before high-pressure freezing. SVs (open black arrowheads), dense core vesicles (DCVs, white closed arrowheads), and dense projection (DP, closed black arrowheads) are indicated. c Distance analysis of nearest vesicles for each analyzed cholinergic micrograph; −light (n = 1473), +light (n = 819). d Relative frequency distribution of nearest vesicle distances shown in c. e Mean nearest distances per section; −light (n = 88), +light (n = 43). f Mean nearest distances per synapse; −light (n = 30), +light (n = 12). g, h Lengths of the PM and DP, respectively; −light (n = 88), +light (n = 43). Data in c, e–h are shown as median with 75–25% interquartile range (IQR). i–p, As for a–h, respectively, but for non-transgenic sng-1(ok234) mutant animals (n = 707, 41, 9 for −light, and 733, 40, 14 for +light; in k, n, l, o, m, p, respectively. Sections originated from two animals, and 9–30 synapses for each condition. Statistical test used: Mann–Whitney (two-tailed) in c, e, g–h, k, m–p; unpaired t-test (two-tailed) in f; Kolmogorov–Smirnov in d, l; ***p < 0.001, ns not significant. |