
Fig. 2
- ID
- ZDB-FIG-221226-32
- Publication
- Tanimoto et al., 2022 - Tiltable objective microscope visualizes selectivity for head motion direction and dynamics in zebrafish vestibular system
- Other Figures
- All Figure Page
- Back to All Figure Page
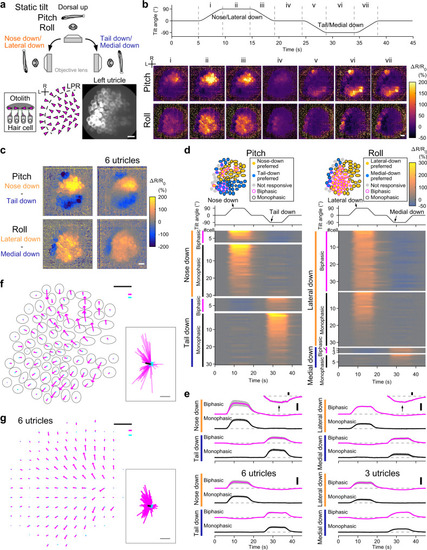
In vivo Ca2+ imaging visualizes direction-selective utricular HC responses to static tilt.
a Imaging of utricular HCs during static tilt in pitch/roll axis (top). Side view of otolith organ (bottom inset). Top-down view of hair-bundle polarity (magenta arrowheads) reversing at a line of polarity reversal (LPR, dashed line) (bottom left). R: rostral. L: lateral. The same orientation applies to (b–d), (f), and (g). Left utricular HCs in a 5 dpf Tg(myo6b:jGCaMP7f; myo6b:tdTomato) larva (bottom right). Green channel is shown. Scale bar: 10 μm. b HC responses to 90° static tilt (see Supplementary Movie 3). Tilt time course (top). Sequential images showing mean ΔR/R0 responses during the time period “i” to “vii” (bottom). Average of 5 trials. Scale bar: 10 μm. Data from the same utricle is shown in (c), (d), (e), and (f). c Response selectivity for tilt direction. Tail-down response (“vi” in [b]) subtracted from nose-down response (“ii” in [b]) (top). Medial-down response (“vi” in [b]) subtracted from lateral-down response (“ii” in [b]) (bottom). The same utricle shown in (b) (left). Average of 6 utricles (right). Scale bar: 10 μm. d Tilt responses to pitch (left) and roll (right) tilts per HC. HC location (top). Tilt time course (middle). Response (ΔR/R0) time course grouped by preferred tilt direction and response directionality (bottom). Average of 5 trials. Data from the same utricle shown in (b). e Mean ΔR/R0 time course across HCs in each preference group in (d) (top). Negative responses are vertically magnified (insets, scale bar: 10% ΔR/R0). Number of cells is reported in the Supplementary Fig. 2 legend. Mean responses (6 utricles for pitch, 3 left utricles for roll [3 right utricles are shown in Supplementary Fig. 2f]) (bottom). Deviation (SEM) is shown in gray. Tilt time course is the same as in (d). Scale bar: 100% ΔR/R0. (f, g) Example (f) and summary (g) of HC response vectors. Orientation of arrows indicates preferred (magenta)/anti-preferred (cyan) direction. Length of arrows indicates ΔR/R0 amplitude (f) and mean amplitude per grid (g, see “Methods”). Gray: HC contour (f). Magenta and cyan scale bars: 100% ΔR/R0. Black scale bar: 10 μm. (inset) All response vectors aligned together. Mean vectors to the preferred (black)/anti-preferred (gray) direction are overlaid. Scale bar: 100% ΔR/R0. Source data are provided as a Source Data file. |