
- Title
-
Tiltable objective microscope visualizes selectivity for head motion direction and dynamics in zebrafish vestibular system
- Authors
- Tanimoto, M., Watakabe, I., Higashijima, S.I.
- Source
- Full text @ Nat. Commun.
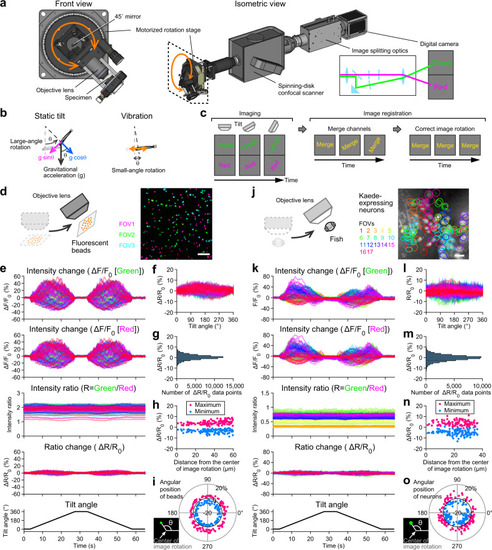
Tiltable objective microscope enables functional imaging during 360° static tilt and vibration.
a Schematic showing a tiltable objective microscope. An objective lens and a specimen are tilted by a motorized rotation stage (see Supplementary Movie 1). b Gravitational vector components (magenta and blue arrows) during static tilt produced by large-angle, slow rotation (left). Inertial acceleration during vibration (orange arrows) produced by small-angle, fast rotation (right) (see Supplementary Fig. 1). c Rotated images are merged and registered by correcting the image rotation (see Supplementary Movie 2 and “Methods”). d Fluorescent beads. Images from 3 fields of view (FOVs) are superimposed. Scale bar: 20 μm. e Time course of beads fluorescent intensity changes during 360° tilt. Large fluctuation in green and red signals is reduced in ratio and ratio change (ΔR/R0). 116 beads from 3 FOVs. f Relationship between tilt angle and ΔR/R0. g Distribution of ΔR/R0 values during tilt. h Relationship between beads distance from the center of image rotation, which is the center of the image in [d], and ΔR/R0 maximum (red) and minimum (blue). i Relationship between the angular position of beads around the center of image rotation, which is the center of the image in [d], and ΔR/R0 maximum (red) and minimum (blue). j Brain neurons expressing green- and red-Kaede in Tg(nefma-hs:Gal4; UAS:Kaede) larval zebrafish at 5 dpf. Images from 17 FOVs are superimposed. Red channel is shown in grayscale. Positions of neurons are labeled by FOV colors. Scale bar: 10 μm. k Time course of neuronal fluorescent intensity changes during 360° tilt. Large fluctuation in green and red signals is reduced in ratio and ΔR/R0. 116 neurons from 17 FOVs. l Relationship between tilt angle and ΔR/R0. m Distribution of ΔR/R0 values during tilt. n Relationship between neuron distance from the center of image rotation, which is the center of the image in [j], and ΔR/R0 maximum (red) and minimum (blue). i Relationship between angular position of neurons around the center of image rotation, which is the center of the image in [j], and ΔR/R0 maximum (red) and minimum (blue). Source data are provided as a Source Data file. |
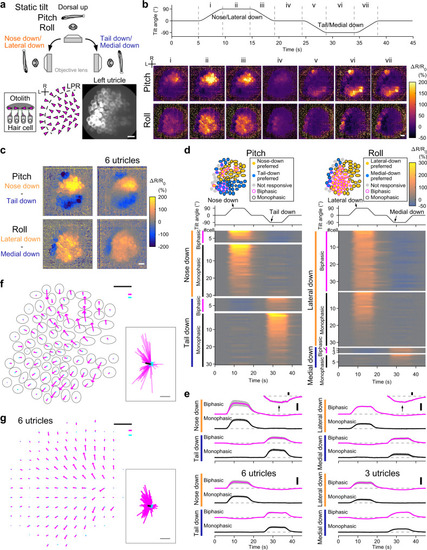
In vivo Ca2+ imaging visualizes direction-selective utricular HC responses to static tilt.
a Imaging of utricular HCs during static tilt in pitch/roll axis (top). Side view of otolith organ (bottom inset). Top-down view of hair-bundle polarity (magenta arrowheads) reversing at a line of polarity reversal (LPR, dashed line) (bottom left). R: rostral. L: lateral. The same orientation applies to (b–d), (f), and (g). Left utricular HCs in a 5 dpf Tg(myo6b:jGCaMP7f; myo6b:tdTomato) larva (bottom right). Green channel is shown. Scale bar: 10 μm. b HC responses to 90° static tilt (see Supplementary Movie 3). Tilt time course (top). Sequential images showing mean ΔR/R0 responses during the time period “i” to “vii” (bottom). Average of 5 trials. Scale bar: 10 μm. Data from the same utricle is shown in (c), (d), (e), and (f). c Response selectivity for tilt direction. Tail-down response (“vi” in [b]) subtracted from nose-down response (“ii” in [b]) (top). Medial-down response (“vi” in [b]) subtracted from lateral-down response (“ii” in [b]) (bottom). The same utricle shown in (b) (left). Average of 6 utricles (right). Scale bar: 10 μm. d Tilt responses to pitch (left) and roll (right) tilts per HC. HC location (top). Tilt time course (middle). Response (ΔR/R0) time course grouped by preferred tilt direction and response directionality (bottom). Average of 5 trials. Data from the same utricle shown in (b). e Mean ΔR/R0 time course across HCs in each preference group in (d) (top). Negative responses are vertically magnified (insets, scale bar: 10% ΔR/R0). Number of cells is reported in the Supplementary Fig. 2 legend. Mean responses (6 utricles for pitch, 3 left utricles for roll [3 right utricles are shown in Supplementary Fig. 2f]) (bottom). Deviation (SEM) is shown in gray. Tilt time course is the same as in (d). Scale bar: 100% ΔR/R0. (f, g) Example (f) and summary (g) of HC response vectors. Orientation of arrows indicates preferred (magenta)/anti-preferred (cyan) direction. Length of arrows indicates ΔR/R0 amplitude (f) and mean amplitude per grid (g, see “Methods”). Gray: HC contour (f). Magenta and cyan scale bars: 100% ΔR/R0. Black scale bar: 10 μm. (inset) All response vectors aligned together. Mean vectors to the preferred (black)/anti-preferred (gray) direction are overlaid. Scale bar: 100% ΔR/R0. Source data are provided as a Source Data file. |
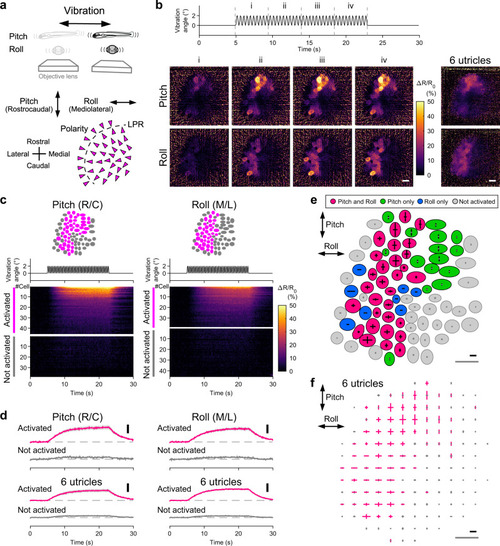
In vivo Ca2+ imaging visualizes a subset of utricular HCs receiving head vibration.
a Schematic showing imaging of utricular HCs during vibration in pitch/roll axis (top). Hair-bundle polarity (arrowheads) and vibration axes (double-headed arrows) (bottom). The same orientation applies to (b), (c), (e), and (f). b Example of HC responses to vibration stimulus in pitch and roll axes (see Supplementary Movie 4). Vibration time course (top). Sequential images showing mean ΔR/R0 responses during the time period “i” to “iv” (left). Average of 8 trials. Organ-average of the mean ΔR/R0 responses during the time period “iv” in 6 utricles (right). Scale bar: 10 μm. c Example of vibration responses per HC. The same utricle shown in (b). Responses to pitch (left) and roll (right) vibration. HC location (top). Vibration time course (middle). ΔR/R0 per HC (bottom). R/C: rostrocaudal; M/L: mediolateral. d Mean ΔR/R0 time course in HC groups in (c) (top). Pitch: 45 cells activated; 38 cells not activated. Roll: 38 cells activated; 45 cells not activated. Mean of the 6 utricles (bottom). Deviation (SEM) is shown in gray. Vibration time course is the same as in C. Scale bar: 10% ΔR/R0. R/C: rostrocaudal; M/L: mediolateral. Example (e: the same utricle shown in [b]) and summary (f) of HC response vectors. Orientation of bars indicates stimulus direction. Length of bars indicates ΔR/R0 amplitude (e) or mean amplitude per grid that is larger (magenta) or not larger (gray) than 5% (f, see “Methods”). Black scale bar: 20% ΔR/R0. Gray scale bar: 10 μm. Source data are provided as a Source Data file. |

Head vibration and static tilt are preferentially transduced by striolar and extrastriolar HCs, respectively.
a, b A horizontal optical slice of utricle in a 5 dpf transgenic fish, Tg(myo6b:jGCaMP7f; s100s-hs:tdTomato). Striola is enclosed by a dashed line. Scale bar: 10 μm. R: rostral. L: lateral. Similar results were obtained in 6 experiments. c, d Summary of HC response vectors from 6 utricles. Mean ΔR/R0 vectors per grid. Striola is enclosed by a dashed line. Black scale bar: 10 μm. c Orientation and length of arrows indicate preferred (magenta)/anti-preferred (cyan) direction and ΔR/R0 amplitude, respectively. Magenta and cyan scale bars: 100% ΔR/R0 (d) orientation and length of bars indicate stimulus direction and ΔR/R0 amplitude, respectively. Magenta scale bar: 20% ΔR/R0. e Polar histogram showing number of HCs (radial axis) against HC polarity (angular axis) determined by orientation of tilt response vectors. Bin size: 10°. f Example of HC groups, each of which has a similar polarity (top). Color code for HC polarity groups with bin size 10° (bottom). g, h Pairwise comparison of mean ΔR/R0 response vector length between striolar and extrastriolar HCs in 6 utricles (18 HC polarity groups). Color code shown in (f). Two-sided Wilcoxon signed-rank test (g, p = 1.1 × e−4; h, p = 7.6 × e−6). Source data are provided as a Source Data file. |

Topographic representation of head tilt direction in VGNs.
a Imaging of VGNs (top). VGNs in the rostral division of VG in a 5 dpf Tg(myo6b:jGCaMP7f; myo6b:tdTomato) larva imaged from ventral (bottom). Red channel is shown. Scale bar: 10 μm. The same orientation applies to (b)–(e), (g), and (h). b VGN responses to 90° static tilt (see Supplementary Movie 5). Tilt time course (top). Sequential images showing mean ΔR/R0 responses during the time period “i” to “vi” (bottom). Maximum intensity projection of six optical slices with 5 μm intervals. Single trial at each slice. Dashed lines: VG contours. Scale bar: 10 μm. The same ganglion is shown in (c), (d), (e), and (g). Response selectivity for tilt direction in images of maximum intensity projection (c) and different depth (d). Tail-down response (“v” in [b]) subtracted from nose-down response (“ii” in [b]) (top). Medial-down response (“v” in [b]) subtracted from lateral-down response (“ii” in [b]) (bottom). Dashed lines: VG contours. Scale bar: 10 μm. Average of 6 ganglia ([c], right). e Tilt responses per VGN. VGN location (top, 6 optical slices overlaid). Tilt time course (middle). ΔR/R0 responses (bottom). f Mean ΔR/R0 responses across VGNs in each preference group in a single VG (top). Number of cells is reported in the Supplementary Fig. 4 legend. Mean responses of each group (bottom, 6 VG for pitch; 3 left VG for roll; 3 right VG are shown in Supplementary Fig. 4e). SEM is shown in gray. Tilt time course is the same as in (e). Scale bar: 50% ΔR/R0. g VGN response vectors. Orientation and length of arrows indicate preferred direction and ΔR/R0 amplitude, respectively. Responses with amplitude larger than 10% ΔR/R0 are shown. Gray: VGN contours. Magenta scale bar: 50% ΔR/R0. Black scale bar: 10 μm. (right-end panel) All response vectors aligned together. Black bar: mean response vector. Magenta scale bar: 50% ΔR/R0. h Summary of VGN response vectors from 6 ganglia. Mean response vectors per grid (see “Methods”). Arrows and gray dots show mean response vectors with amplitude larger or not larger than 10% ΔR/R0, respectively. Colors and scale bars are the same as in (g). Source data are provided as a Source Data file. |
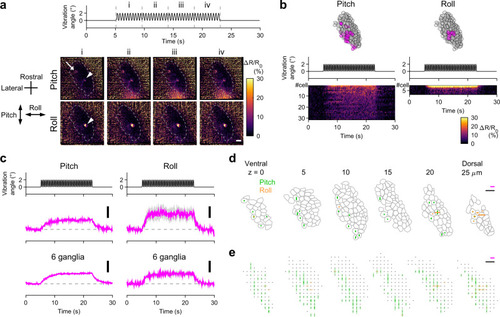
A subpopulation of VGNs relay head vibration signals.
a Example of VGN responses to head vibration in pitch/roll axis (see Supplementary Movie 6). Vibration time course (top). Sequential images showing changes of mean ΔR/R0 during the time period “i” to “iv” from those during the pre-stimulus period (time 0 to 5 s) (bottom). Maximum intensity projection of VGNs in the rostral division of VG spanning a depth of 25 μm in a Tg(myo6b:jGCaMP7f; myo6b:tdTomato) larva imaged from ventral at 5 dpf. One neuron responds to both stimuli (arrowheads) whereas another responds to only pitch vibration (arrow). Dashed lines: VG contours. Scale bar: 10 μm. b Example of vibration responses per VGN. The same ganglion shown in (a). Responses to pitch (left) and roll (right) vibration. Location of activated (magenta) and not-activated (gray) VGNs (top, 6 optical slices overlaid). Vibration time course (middle). Responses (ΔR/R0) per activated VGNs (bottom). c Mean responses in activated VGNs. Vibration time course (top). Mean ΔR/R0 (middle). Pitch: 31 cells. Roll: 8 cells. Mean ΔR/R0 in 6 ganglia (bottom). Deviation (SEM) is shown in gray. Scale bar: 10% ΔR/R0. Example (d) and summary (e) of VGN response vectors. Magenta scale bar: 20% ΔR/R0. Black scale bar: 10 μm. d The same VG shown in (a). Bars indicate ΔR/R0 amplitude in activated VGNs. Gray: VGN contours. e Responses from 6 VG shown in translucent, overlaid bars (see “Methods”). Gray dots: not-activated VGNs. Source data are provided as a Source Data file. |
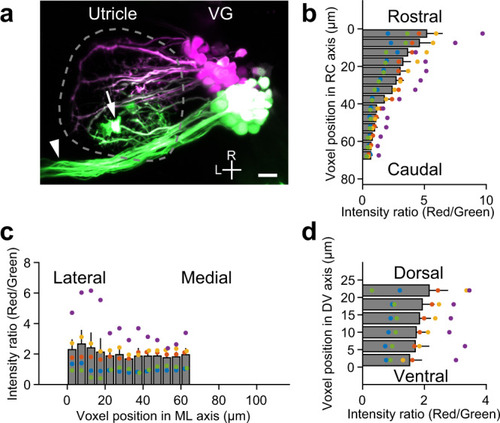
VGNs innervate utricular HCs in a topographic manner.
a Maximum intensity projection image of VGNs expressing Kaede in a Tg(hspGFF53A; UAS:Kaede) larva at 5 dpf. Green-Kaede (green) is photoconverted to red-Kaede (magenta) only in the rostral vestibular ganglion (VG) somata. Dashed line encloses the utricle. Horizontal canal nerve (arrowhead) and ectopic Kaede-expressing cells (asterisk) overlapping the utricle are excluded from quantitative analysis. R: rostral. L: lateral. Scale bar: 10 μm. Distribution of voxel fluorescence intensity ratio (red/green) in utricles in the rostrocaudal (RC) (b), mediolateral (ML) (c), and dorsoventral (DV) (d) axes. Mean and SEM from 5 utricles. Large ratio values indicate a large amount of photoconverted red-Kaede fluorescence in the voxels. Source data are provided as a Source Data file. |