
Fig. 2
- ID
- ZDB-FIG-221214-9
- Publication
- Engerer et al., 2021 - Notch-mediated re-specification of neuronal identity during central nervous system development
- Other Figures
- All Figure Page
- Back to All Figure Page
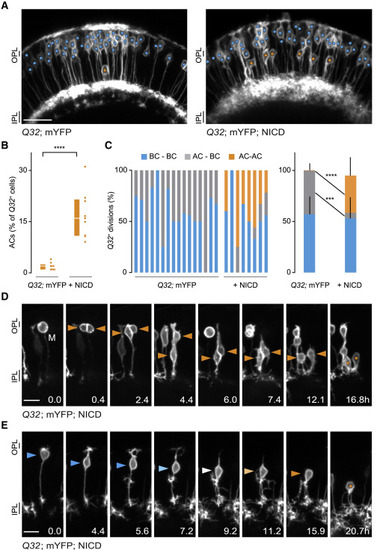
Figure 2. Notch signaling promotes AC fate in the vsx1 lineage (A) 3 dpf retinae from Q32 WT and Q32 NICD. BCs (cyan circles), ACs (orange circles). (B) Proportion of ACs in WT and Q32 NICD. Median and interquartile range (IQR) shown. Q32 WT (21 ACs, 9 fish); Q32 NICD (140 ACs, 9 fish), p < 0.0001, Mann-Whitney U test. (C) Proportion of Q32 divisions in WT and following NICD OE for each fish (left). Collective representation of Q32 divisions, representing median and IQR per group (right). BC-BC: Q32 WT versus NICD, p = 0.5134. AC-BC: Q32 WT versus NICD, p = 0.0004. AC-AC: Q32 WT versus NICD, p < 0.0001. WT: 141 Q32 divisions, 16 fish; Q32 NICD: 44 divisions, 8 fish. Mann-Whitney U test. (D) 2 dpf Q32 NICD retina, showing a mitotic progenitor (M) generating 2 ACs (orange arrowheads; circles, last time point). (E) 2 dpf Q32 NICD retina, showing a BC (cyan arrowhead), transdifferentiating into an AC (orange arrowhead; circle, last time point). Scale bars, 20 μm (A); 10 μm (D and E). See also Figures S1, S3D, and S3E. |