
Fig. 4
- ID
- ZDB-FIG-221214-11
- Publication
- Engerer et al., 2021 - Notch-mediated re-specification of neuronal identity during central nervous system development
- Other Figures
- All Figure Page
- Back to All Figure Page
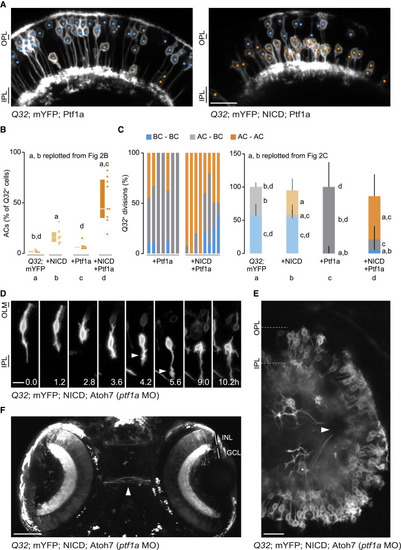
Figure 4. Notch signaling imparts plasticity to nascent post-mitotic cells (A) 3 dpf retinae from Q32 Ptf1a and Q32 NICD Ptf1a fish. Q32 BCs (cyan circles), ACs (orange circles). (B) Proportion of ACs in Q32 Ptf1a and Q32 NICD Ptf1a represented as median and IQR. Q32 Ptf1a (66 ACs, 9 fish), Q32 NICD Ptf1a (372 ACs, 9 fish). Q32 WT and Q32 NICD originally plotted in Figure 2B. Significant differences found between WT and NICD (p = 0.0003), WT and NICD Ptf1a (p < 0.0001), and Ptf1a and NICD Ptf1a (p = 0.0005), denoted by a (significantly different from Q32 WT), b (from NICD), c (from Ptf1a), or d (from NICD Ptf1a). Kruskal-Wallis and post hoc Dunn’s multiple comparisons test, further adjusted by the Benjamini-Hochberg false discovery rate (FDR) method. (C) Q32 divisions in Q32 Ptf1a and Q32 Ptf1a NICD for each fish (left). Divisions representing median and IQR per group (right). Q32 Ptf1a: 42 divisions, 7 fish; Q32 NICD Ptf1a: 52 divisions, 8 fish. Q32 WT and Q32 NICD originally plotted in Figure 2C. Significant differences were found in BC-BC divisions: WT versus Ptf1a (p = 0.0001), WT versus NICD Ptf1a (p = 0.0004), NICD versus Ptf1a (p = 0.0029), NICD versus NICD Ptf1a (p = 0.0075); AC-BC divisions: WT versus NICD (p = 0.0127), NICD versus Ptf1a (p = 0.0001), Ptf1a versus NICD Ptf1a (p = 0.0034); AC-AC divisions: WT versus NICD (p = 0.0007), WT versus NICD Ptf1a (p < 0.0001), Ptf1a versus NICD Ptf1a (p = 0.0035), denoted as in (B). Kruskal-Wallis and post hoc Dunn’s multiple comparisons test, further adjusted by the Benjamini-Hochberg FDR method. (D) An emerging GC-like cell in a 2-dpf Q32 mYFP NICD Atoh7 retina with ptf1a morpholino (MO). The cell migrates basally, loses its bipolar morphology, and grows out an axon (arrowhead) and apically directed processes. (E) Two Q32 GC-like cells in a 3-dpf transgenic embryo (Q32; mYFP; NICD; Atoh7 and ptf1a MO). Putative axons exit the retina (arrowhead). Gamma adjusted. (F) Dorsal view of a 3-dpf embryo (rostral top, eyes lateral) in which GC-like cells were induced (Q32; mYFP; NICD; Atoh7 and ptf1a MO), showing axons at the chiasm (arrowhead). Gamma adjusted. Scale bars, 20 μm (A); 10 μm (D and E); 100 μm (F). GCL, ganglion cell layer; INL, inner nuclear layer; OLM, outer limiting membrane. See also Figure S4. |