
Figure 3
- ID
- ZDB-FIG-221211-234
- Publication
- Liu et al., 2022 - A New Mechanism for Ginsenoside Rb1 to Promote Glucose Uptake, Regulating Riboflavin Metabolism and Redox Homeostasis
- Other Figures
- All Figure Page
- Back to All Figure Page
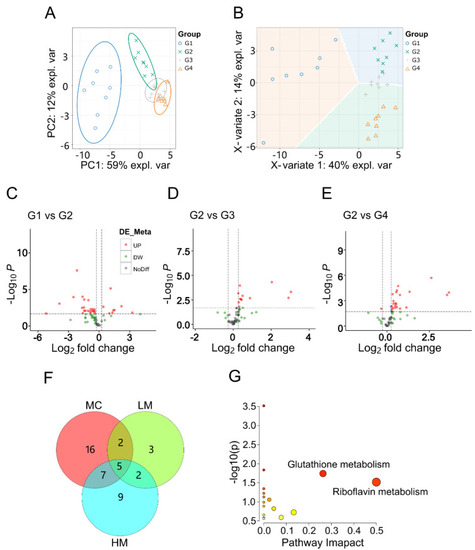
Metabolomic analysis of GRb1 treatment in diabetes zebrafish model. (A,B) Overall metabolic profiles of samples between control, model and test groups using PCA and PLS-DA plots. n = 8 per group. (C–E) Volcano plots of differential metabolites between G1 and G2, G2 and G3, and G2 and G4. G1, larvae exposed in E3 water; G2, larvae treated with 4% glucose; G3, larvae treated with 4% glucose + 100 μg/mL GRb1; G4, larvae treated with 4% glucose + 200 μg/mL GRb1. (F) Venn diagram of differential metabolite amounts. MC represents G2 vs. G1; LM represents G3 vs. G2; HM represents G4 vs. G2. (G) KEGG pathway maps for the differential metabolites. |