
- Title
-
A New Mechanism for Ginsenoside Rb1 to Promote Glucose Uptake, Regulating Riboflavin Metabolism and Redox Homeostasis
- Authors
- Liu, Y., Deng, Y., Wang, F., Liu, X., Wang, J., Xiao, J., Zhang, C., Zhang, Q.
- Source
- Full text @ Metabolites
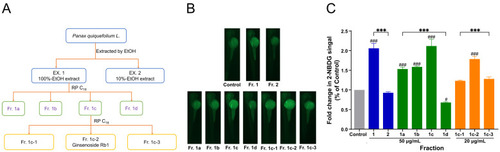
Bioguided separation of the active ingredients in American ginseng. (A) Scheme of bioguided fractionation. (B,C) Fluorescence microscopy images of zebrafish larvae after treatment with different fractions and the fold change in absorption of 2-NBDG quantified by Image J. Blue, green and orange are three different batches. Results are expressed as mean ± SEM. ### p < 0.001, # p < 0.05 vs. control. *** p < 0.001. |
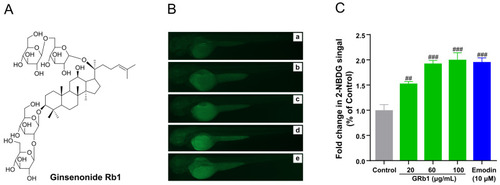
GRb1 induces 2-NBDG uptake in zebrafish larvae. (A) Chemical structures of ginsenoside Rb1. (B) Fluorescence microscopy images of zebrafish larvae treated with different concentrations of GRb1 (20, 60, 100 μg/mL) with 10 μM emodin as a positive control. Control (a), 20 μg/mL GRb1 (b), 60 μg/mL GRb1 (c), 100 μg/mL GRb1 (d) and 10 μM emodin (e). (C) Fold change in 2-NBDG absorption quantified by Image J. Results are expressed as mean ± SEM. ### p < 0.001, ## p < 0.01 vs. control. |
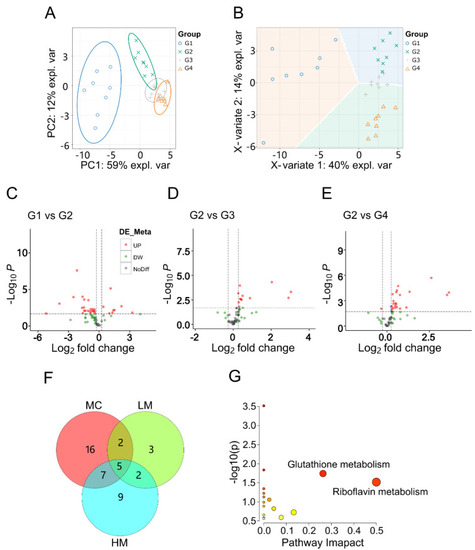
Metabolomic analysis of GRb1 treatment in diabetes zebrafish model. (A,B) Overall metabolic profiles of samples between control, model and test groups using PCA and PLS-DA plots. n = 8 per group. (C–E) Volcano plots of differential metabolites between G1 and G2, G2 and G3, and G2 and G4. G1, larvae exposed in E3 water; G2, larvae treated with 4% glucose; G3, larvae treated with 4% glucose + 100 μg/mL GRb1; G4, larvae treated with 4% glucose + 200 μg/mL GRb1. (F) Venn diagram of differential metabolite amounts. MC represents G2 vs. G1; LM represents G3 vs. G2; HM represents G4 vs. G2. (G) KEGG pathway maps for the differential metabolites. |
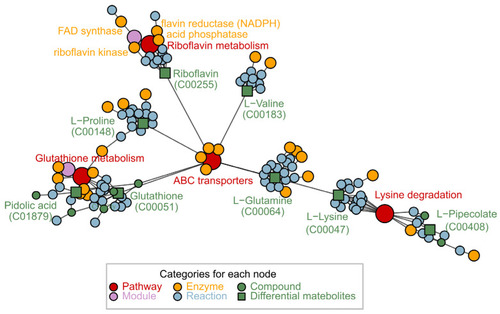
Network diagram related to differentially expressed metabolic pathways after GRb1 treatment by FELLA. |
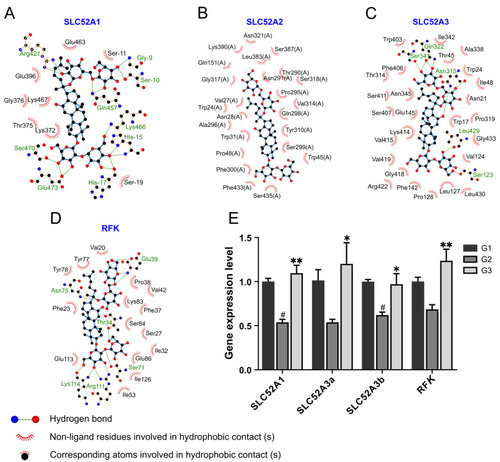
Verification of the role of GRb1 in riboflavin metabolic pathway. (A–D) Ligplot + results for schematic ligand interactions of 4 proteins related to riboflavin metabolic pathway with GRb1 showing hydrogen bonding and hydrophobic interactions. (E) Expression of the mRNA of the proteins related to riboflavin metabolic pathway in larvae after GRb1 treatment. Results are expressed as mean ± SEM, n = 3 per group. # p < 0.05 vs. G1. ** p < 0.01, * p < 0.05 vs. G2. G1, larvae exposed in E3 water; G2, larvae treated with 4% glucose; G3, larvae treated with 4% glucose + 100 μg/mL GRb1. |
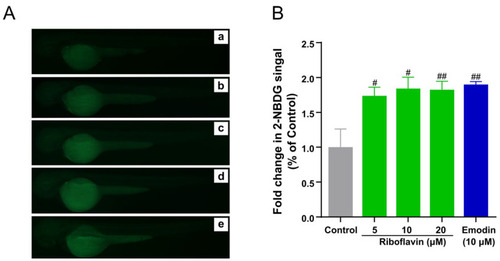
Riboflavin induces 2-NBDG uptake in zebrafish larvae. (A) Fluorescence microscopy images of zebrafish larvae treated with different concentrations of riboflavin (5, 10, 20 μM) with 10 μM emodin as a positive control. Control (a), 5 μM riboflavin (b), 10 μM riboflavin (c), 20 μM riboflavin (d) and 10 μM emodin (e). (B) Fold change in 2-NBDG absorption quantified by Image J. Results are expressed as mean ± SEM. ## p < 0.01, # p < 0.05 vs. control. |
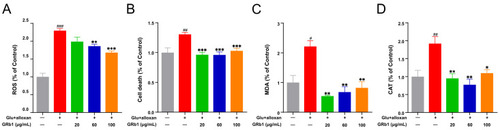
GRb1 treatment attenuates oxidative stress in a diabetes zebrafish model. ROS production (A), cell death (B), MDA levels (C) and CAT activity (D) in diabetes zebrafish larvae treated with different concentrations of GRb1. Results are expressed as mean ± SEM. ### p < 0.001, ## p < 0.01, # p < 0.05 vs. control. *** p < 0.001, ** p < 0.01, * p < 0.05 vs. model. |

Riboflavin supplementation attenuates oxidative stress in a diabetes zebrafish model. ROS production ((A), cell death (B), MDA levels (C) and CAT activity (D) in diabetic zebrafish larvae treated with different concentrations of riboflavin. Results are expressed as mean ± SEM. ### p < 0.001, ## p < 0.01, # p < 0.05 vs. control. *** p < 0.001, ** p < 0.01, * p < 0.05 vs. model. |