
Fig. 3
- ID
- ZDB-FIG-221210-11
- Publication
- Xiong et al., 2021 - SLC1A1 mediated glutamine addiction and contributed to natural killer T-cell lymphoma progression with immunotherapeutic potential
- Other Figures
- All Figure Page
- Back to All Figure Page
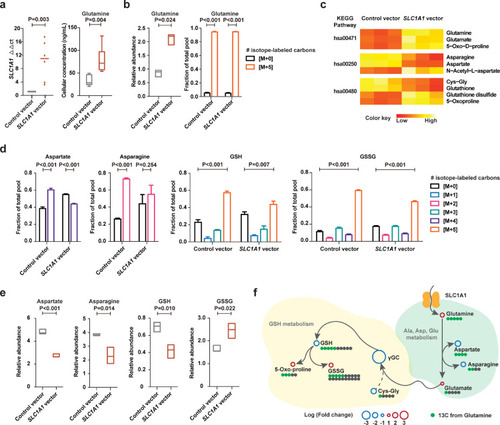
Increased glutamine uptake mediated by SLC1A1 enhanced glutathione metabolic flux. (a) SLC1A1 mRNA expression (left panel) and cellular glutamine levels (right panel) in NK-92 cells transfected with SLC1A1 vector or control vector. The control vector values of SLC1A1 mRNA expression were normalized to 1. (b) Relative abundance (left panel) and isotope-labeled fraction (right panel) of glutamine in NK-92 cells transfected with SLC1A1 vector or control vector. (c) Heatmaps of isotope-labeled metabolites significantly altered in NK-92 cells transfected with SLC1A1 vector, comparing with control vector. The aberrant metabolites were enriched into the KEGG pathways indicated at left: hsa00471, D-glutamine and D-glutamate metabolism; hsa00250, alanine, aspartate and glutamate metabolism; hsa00480, glutathione metabolism. (d and e) The isotope-labeled fraction (d) and relative abundance (e) of aspartate, asparagine, GSH, and GSSG in NK-92 cells transfected with SLC1A1 vector or control vector. (f) A schematic to show the metabolic flux of isotope-labeled glutamine. Assays in (a, right panel) were set up in 6 replications. Assays in (b), (d) and (e) were set up in triplicate. Data in (a), (b), (d) and (e) were represented as mean ±SD. P values in (a), (b), (d) and (d) were calculated with unpaired t-test. |