|
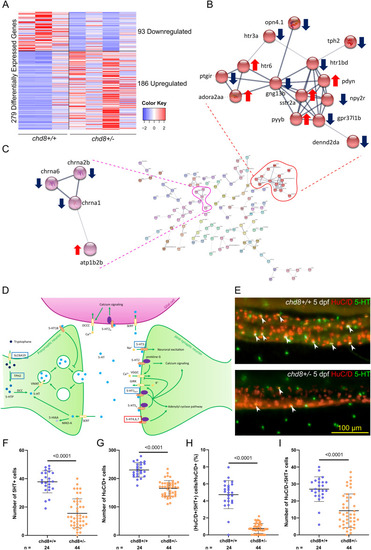
Acetylcholine and serotonin signaling pathways are altered in the enteric neurons of chd8 sa19827/+ larvae. (A) Heatmap shows gene expression for the 279 differentially expressed genes: 93 down-regulated genes and 186 up-regulated genes in chd8 sa19827/+. Values have been centered and scaled for each row. Each row represents a single gene. The full list of genes, P-values, and associated annotations is provided in Supplemental Data 1. (B, C) Protein–protein interaction network of the differentially expressed genes in chd8 sa19827/+. Nodes with no interactions with other proteins of the protein–protein interaction network are not shown. Line thickness indicates the strength of data support. The full network is shown in Fig S2. (B) Cluster of 14 proteins including four proteins of the serotonin signaling pathway: htr1bd, htr3a, htr6, and tph2. (C) Cluster of four proteins including three proteins involved in the acetylcholine signaling pathway: chrna1, chrna2b, and chrna6. (D) Serotonergic synapse adapted from KEGG pathways. Genes boxed in blue denote down-regulated genes, and genes boxed in red denote up-regulated genes. (E) Representative lateral images of the intestine of chd8+/+ and chd8 sa19827/+ zebrafish larvae at 5 days post-fertilization stained with anti-HuC/D and anti-5-HT monoclonal antibodies to visualize the enteric post-mitotic neurons and the enteric serotonergic cells, respectively. White arrowheads show serotonergic neurons (HuC/D- and 5-HT–positive cells). (F) Dot plot of the number of 5-HT–positive cells for each condition tested. A t test was conducted between pairs of conditions. (G) Dot plot of the number of HuC/D-positive cells for each condition tested. A Mann–Whitney test was conducted between pairs of conditions. (H) Dot plot showing the percentage of serotonergic neurons, for each condition tested. A Mann–Whitney test was conducted between pairs of conditions. (I) Dot plot of the number of HuC/D-negative/5-HT–positive cells for each condition tested. A Mann–Whitney test was conducted between pairs of conditions. n, number of larvae.
|