
- Title
-
Loss of autism-candidate CHD8 perturbs neural crest development and intestinal homeostatic balance
- Authors
- Hayot, G., Massonot, M., Keime, C., Faure, E., Golzio, C.
- Source
- Full text @ Life Sci Alliance
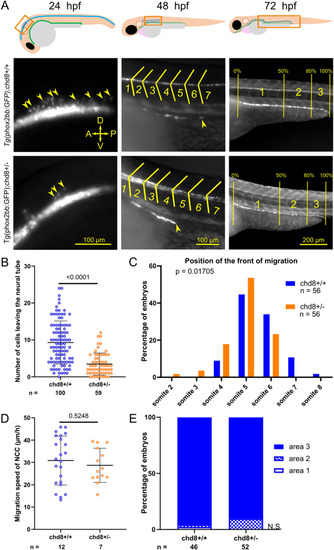
Heterozygous loss of chd8 leads to induction and early migration defects of vagal NCCs. (A) Representative lateral images of Tg2(phox2bb:EGFP);chd8+/+ and Tg2(phox2bb:EGFP);chd8sa19827/+ zebrafish larvae at 24, 48, and 72 hours post-fertilization (hpf) and schematics showing the imaged areas. At 48 hpf, the somite chevrons are outlined in yellow and the front of migration is indicated by a yellow arrowhead. At 72 hpf, vertical yellow lines delimit the borders of the three following areas: area 1 represents 0–50% migration, area 2 represents 51–80% migration, and area 3 represents 81–100% migration. (B) Dot plot of the number of phox2bb-positive cells leaving the neural tube at 24 hpf. A Mann–Whitney test was conducted between pairs of conditions. (C) Histogram of the position of the front of migration of enteric NCCs at 48 hpf, using somites as morphological landmarks. Fisher’s exact test was conducted between pairs of conditions. (D) Dot plot of the measured speed of enteric NCCs between 50 and 54 hpf for each condition tested. A t test was conducted between pairs of conditions. (E) Bar graph representing qualitative scoring of the position of the front of migration of enteric NCCs at 72 hpf. Fisher’s exact test was conducted between pairs of conditions. A, anterior; P, posterior; D, dorsal; V, ventral; n, number of embryos or larvae; and n.s., non-significant. EXPRESSION / LABELING:
PHENOTYPE:
|
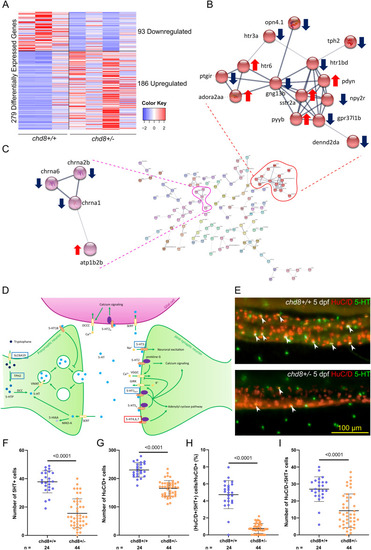
Acetylcholine and serotonin signaling pathways are altered in the enteric neurons of chd8 sa19827/+ larvae. (A) Heatmap shows gene expression for the 279 differentially expressed genes: 93 down-regulated genes and 186 up-regulated genes in chd8 sa19827/+. Values have been centered and scaled for each row. Each row represents a single gene. The full list of genes, P-values, and associated annotations is provided in Supplemental Data 1. (B, C) Protein–protein interaction network of the differentially expressed genes in chd8 sa19827/+. Nodes with no interactions with other proteins of the protein–protein interaction network are not shown. Line thickness indicates the strength of data support. The full network is shown in Fig S2. (B) Cluster of 14 proteins including four proteins of the serotonin signaling pathway: htr1bd, htr3a, htr6, and tph2. (C) Cluster of four proteins including three proteins involved in the acetylcholine signaling pathway: chrna1, chrna2b, and chrna6. (D) Serotonergic synapse adapted from KEGG pathways. Genes boxed in blue denote down-regulated genes, and genes boxed in red denote up-regulated genes. (E) Representative lateral images of the intestine of chd8+/+ and chd8 sa19827/+ zebrafish larvae at 5 days post-fertilization stained with anti-HuC/D and anti-5-HT monoclonal antibodies to visualize the enteric post-mitotic neurons and the enteric serotonergic cells, respectively. White arrowheads show serotonergic neurons (HuC/D- and 5-HT–positive cells). (F) Dot plot of the number of 5-HT–positive cells for each condition tested. A t test was conducted between pairs of conditions. (G) Dot plot of the number of HuC/D-positive cells for each condition tested. A Mann–Whitney test was conducted between pairs of conditions. (H) Dot plot showing the percentage of serotonergic neurons, for each condition tested. A Mann–Whitney test was conducted between pairs of conditions. (I) Dot plot of the number of HuC/D-negative/5-HT–positive cells for each condition tested. A Mann–Whitney test was conducted between pairs of conditions. n, number of larvae. |
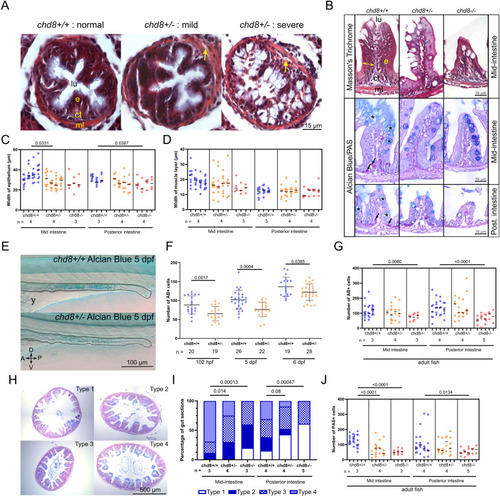
Altered intestinal architecture in chd8 heterozygous and homozygous mutants at larval and adult stages. (A) Representative images of intestinal cross sections of chd8+/+ and chd8 sa19827/+ zebrafish larvae at 5 days post-fertilization (dpf) that underwent Masson’s trichrome staining. Yellow arrows point to gaps between the epithelium and the muscle layers. (B) Representative images of cross sections of the mid- and posterior intestines of chd8+/+, chd8 sa19827/+, and chd8 sa19827/sa19827 adult zebrafish that underwent Masson’s trichrome and Alcian blue (AB)/periodic acid–Schiff (PAS) stainings. Black arrows point to PAS-positive cells, and black asterisks indicate AB-positive cells. (C) Dot plot of the measured width of the epithelium in the mid- and posterior intestines for each condition tested. (B) Width of the epithelium is shown by the yellow double arrowheads in (B). A nested t test was conducted between pairs of conditions. (D) Dot plot of the measured width of the muscle layers in the mid- and posterior intestines for each condition tested. A nested t test was conducted between pairs of conditions. (E) Representative lateral images of chd8+/+ and chd8 sa19827/+ zebrafish larvae at 5 dpf that underwent whole-mount AB staining. Dashed lines denote the intestinal margins. (F) Dot plot showing the number of AB-positive cells in the intestines of chd8+/+ and chd8 sa19827/+ zebrafish larvae at 5 dpf. A t test was conducted between pairs of conditions. (B, G) Dot plot showing the number of AB-positive cells, shown by black asterisks in (B), in the mid- and posterior intestines for each condition tested. A nested t test was conducted between pairs of conditions. (H) Representative images of intestinal cross sections of the mid-intestines of chd8+/+, chd8 sa19827/+, and chd8 sa19827/sa19827 adult zebrafish, stained with AB/PAS. The presence of mucus was scored based on four qualitative types: absence of mucus (type 1), mucus only present at the top border of the villi (type 2), presence of mucus in the intestinal lumen (type 3), and mucus present at the top of the villi and in the intestinal lumen (type 4). (H, I) Qualitative scoring of the presence of mucus in mid- and posterior intestines for each condition tested based on the types defined in (H). Fisher’s exact test was conducted. (B, J) Dot plot showing the number of PAS-positive cells, shown by black arrows in (B), in the mid- and posterior intestines for each condition tested. A nested t test was conducted between pairs of conditions. Each column in panels (C, D, G, J) corresponds to one fish, and each dot represents one tissue section (either an average of the five measurements for panel (C, D) or an absolute number of AB- and PAS-positive cells for panels (G, J), respectively). lu, lumen; e, epithelium; ct, conjunctive tissue; ml, muscle layers; A, anterior; P, posterior; D, dorsal; V, ventral; n, number of adult fish or larvae; and y, yolk. |
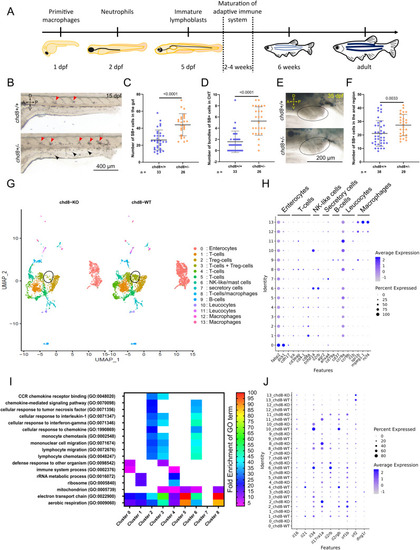
Altered immune balance in the absence of chd8. (A) Schematic showing the development of the zebrafish innate and adaptive immune system. (B) Representative lateral images of chd8+/+ and chd8sa19827/+ zebrafish larvae at 15 days post-fertilization, stained with Sudan Black (SB). Red arrowheads denote the presence of SB-positive bundles (i.e., >five SB-positive cells) in the caudal hematopoietic tissues, and black arrowheads denote the presence of SB-positive neutrophils. (C) Dot plot showing the number of SB-positive cells in the intestine for each condition tested. A t test was conducted between pairs of conditions. (D) Dot plot showing the number of bundles of SB-positive cells in the caudal hematopoietic tissues for each condition tested. A Mann–Whitney test was conducted between pairs of conditions. (E) Representative lateral images of the anal region, circled in black, of chd8+/+ and chd8sa19827/+ zebrafish juveniles at 35 days post-fertilization, stained with SB. Large SB-positive areas outside the anal region are lipids and are not quantified. (F) Dot plot showing the number of SB-positive cells in the anal region for each condition tested. A Mann–Whitney test was conducted between pairs of conditions. (G) UMAP of cells from whole mid- and posterior intestines from both adult homozygous chd8 mutants and controls, colored by cluster assignment. The black circle denotes foxp3a-positive Treg cells. (H) Cell-type signatures. The color of the dot shows the level of gene expression, and the size of the dot shows the percentage of cells per cluster that express the gene of interest. (I) Heatmap showing a subset of statistically significant GO terms, represented by at least 40 genes, identified using a PANTHER overrepresentation test (FDR = 0.05) for up-regulated genes in eight clusters. The colors represent the fold enrichment for each GO term. The full list of associated terms and P-values for each cluster is provided in Supplemental Data 2. (J) Dysregulation of immune-related genes. The color of the dot shows the level of the expression of genes of interest, and the size of the dot shows the percentage of cells per cluster that express the gene of interest. A, anterior; P, posterior; D, dorsal; V, ventral; and n, number of adult fish or juveniles. PHENOTYPE:
|

|

Nodes with no interactions with other proteins of the PPI network are not shown. Markov Cluster Algorithm clustering was performed, using a 3.1 inflation parameter. Red line: fusion evidence; blue line: co-occurrence evidence; yellow line: text mining evidence; green line: neighborhood evidence; purple line: experimental evidence; light blue line: database evidence; and black line: co-expression evidence. |

|
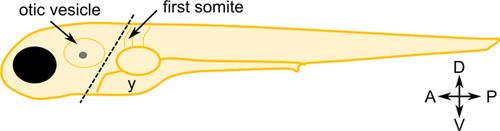
The heads were removed as depicted by the dashed line. A, anterior; P, posterior; D, dorsal; V, ventral; and y, yolk. |