
FIGURE
Figure 10
Figure 10
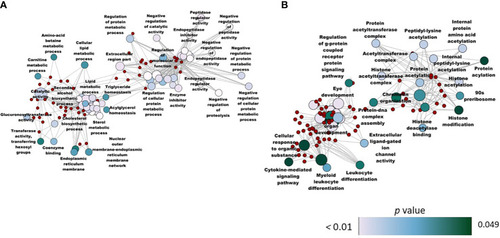
Network plot showing the link between the enriched GO terms. The enriched GO terms that were unique (from the BG and SBM vs CT comparisons) to the zebrafish larvae fed with the BG diet are shown in the figure, and 298 and 95 genes were significantly |
Expression Data
Expression Detail
Antibody Labeling
Phenotype Data
Phenotype Detail
Acknowledgments
This image is the copyrighted work of the attributed author or publisher, and
ZFIN has permission only to display this image to its users.
Additional permissions should be obtained from the applicable author or publisher of the image.
Full text @ Front Immunol