
FIGURE
Figure 9
Figure 9
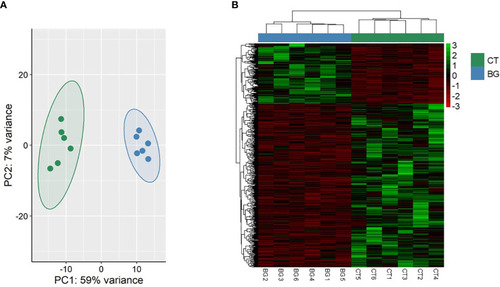
Transcriptome-based differences in the zebrafish larvae from the β-glucan group compared to the control group. Principal component analyses |
Expression Data
Expression Detail
Antibody Labeling
Phenotype Data
Phenotype Detail
Acknowledgments
This image is the copyrighted work of the attributed author or publisher, and
ZFIN has permission only to display this image to its users.
Additional permissions should be obtained from the applicable author or publisher of the image.
Full text @ Front Immunol