
FIGURE
Figure 3
- ID
- ZDB-FIG-221031-185
- Publication
- Pokhrel et al., 2022 - Assessment of Biofilm Formation by Candida albicans Strains Isolated from Hemocultures and Their Role in Pathogenesis in the Zebrafish Model
- Other Figures
- All Figure Page
- Back to All Figure Page
Figure 3
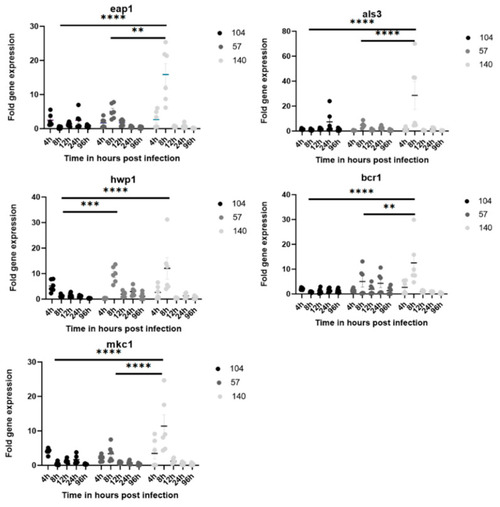
The expression levels of eap1, als3, hwp1, bcr1, and mkc1 in C. albicans strains 104, 57, and 140 infected zebrafish larvae, by time point. Each experimental group of 30 zebrafish was injected with 0.7 OD yeast cells of one of the C. albicans strains. The normalized ratios of expression were calculated by comparison with the level of expression of the act-1 gene in each group of planktonic cells. Each experiment was performed in duplicate. h, hour; **, p < 0.01; ***, p < 0.001; and ****, p < 0.0001. |
Expression Data
Expression Detail
Antibody Labeling
Phenotype Data
Phenotype Detail
Acknowledgments
This image is the copyrighted work of the attributed author or publisher, and
ZFIN has permission only to display this image to its users.
Additional permissions should be obtained from the applicable author or publisher of the image.
Full text @ J Fungi (Basel)