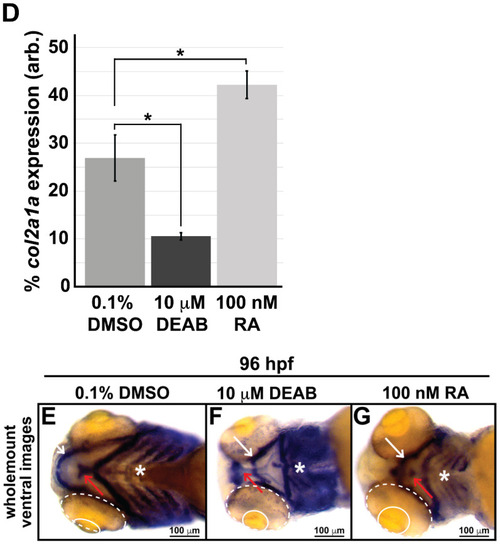
Retinoic acid regulates col2a1a expression in the ocular neural crest. Treatment with 10 mM DEAB, a selective pan-aldehyde dehydrogenase inhibitor, and 100 nM RA effectively decreased and increased, respectively, ocular col2a1a expression in WT Casper zebrafish embryos compared with their DMSO control-treated counterparts. Wholemount in situ analysis was performed using a chromogenic (blue) colorimetric assay (Vector Blue Substrate Kit, Vector Laboratories). Lateral images (A–C) at 60 hpf show the teratogenic effects of pharmacological insult on the ocular development of the treated embryos. The solid and dashed circles highlight the effect on eye size. The black dashed lines indicate the orientation of the plane of section, which passes perpendicular to the spinal column and extends in the rostral-caudal direction. FL microscopy analysis of transverse cephalic sections of the treated embryos at 60 hpf obtained after wholemount colorimetric in situ analysis developed using a fluorescent (Far Red/Cy5) substrate (Vector Blue Substrate Kit, Vector Laboratories) (A’–C’) show the effects of pharmacological insult on the anterior segment within the developing eye. The black arrowhead highlights col2a1a expression in the hyaloid vasculature and the orange arrowhead highlights col2a1a expression in the sclera/periocular mesenchyme. Quantification of these effects (D) shows that DEAB significantly decreased col2a1a expression, while RA significantly increased col2a1a expression. *, p-value ≤ 0.05. Ventral images (E,F,G) of wholemount in situ analysis at 90 hpf show the teratogenic effects of pharmacological insult on the ocular and craniofacial development of treated embryos. The solid and dashed circles highlight the effect on eye size. The white (Meckel’s cartilage development) and red (basihyal development) arrows highlight the effects on jaw development. The asterisks highlight the areas of pharyngeal arch development.