
Fig. 3
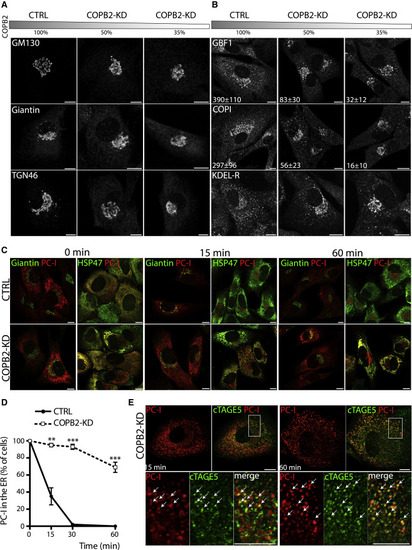
Figure 3. Partial depletion of COPB2 induces disorganization of the Golgi complex and impairs ER exit of PCI in human fibroblasts (A) BJ-5ta human fibroblasts (HFs) were mock (CTRL) or COPB2-siRNA treated for 36 h for obtainment of different levels of COPB2 reduction (to 50% and 35% of control via 20 nM and 100 nM siRNAs, respectively). The gray bar indicates the residual COPB2 protein level after siRNA treatment. Cells were immunolabeled with an antibody against the cis-Golgi marker GM130 (upper panel), medial Golgi marker Giantin (middle panel), and trans-Golgi protein TGN46 (lower panel). Scale bars represent 10 μm. (B) Immunofluorescence analyses of CTRL and COPB2-KD HFs for several proteins of the ER-Golgi intermediate compartment (ERGIC): GBF1, COPI (evaluated with an anti-coatomer mAbCM1A10), and KDEL receptor (all markers in gray). Scale bars represent 10 μm. Numbers represent quantification of GBF1-positive and COPI-positive spots per cell from one representative experiment. N = 3 experiments, n = 50 cells counted, ± SD. (C) PCI transport in human fibroblasts. CTRL and COPB2-KD (50% of residual protein level) cells were shifted to 40°C for 3 h for accumulation of PCI (red) in the ER. Cells were then either fixed immediately (0 min) or incubated for different times (15 and 60 min) at 32°C in the presence of ascorbate and CHX. During the temperature block, both CTRL and COPB2-KD cells accumulate PCI into the ER. In control cells, PCI co-localizes with the Golgi marker Giantin (green) after 15 min but does not in COPB2-KD cells where it fails to exit the ER. PCI and HSP47 co-localized in control and COPB-KD cells at baseline (0 min) and continued to co-localize in COPB2-KD cells (but not in control cells) after 15 and 60 min because of ER retention of PCI. Scale bars represent 10 μm. (D) Quantification of the ER exit of PCI in CTRL and COPB2-KD HFs expressed as percentage of cells with PCI in the ER. N = 3 experiments, n = 100 cells counted. Mean values ± SD (∗∗p < 0.001, ∗∗∗p < 0.0001). (E) PCI transport assay in COPB2-KD human fibroblasts as in (C). Cells were immunolabeled for PCI and cTAGE5 as a marker of the ER exit sites. PCI co-localized with cTAGE5 15 and 60 min after the release. Bottom panels are enlargements of the boxed areas with white arrows indicating the co-localizing PCI with cTAGE5. Scale bars represent 10 μm. |