
- Title
-
COPB2 loss of function causes a coatopathy with osteoporosis and developmental delay
- Authors
- Marom, R., Burrage, L.C., Venditti, R., Clément, A., Blanco-Sánchez, B., Jain, M., Scott, D.A., Rosenfeld, J.A., Sutton, V.R., Shinawi, M., Mirzaa, G., DeVile, C., Roberts, R., Calder, A.D., Allgrove, J., Grafe, I., Lanza, D.G., Li, X., Joeng, K.S., Lee, Y.C., Song, I.W., Sliepka, J.M., Batkovskyte, D., Washington, M., Dawson, B.C., Jin, Z., Jiang, M.M., Chen, S., Chen, Y., Tran, A.A., Emrick, L.T., Murdock, D.R., Hanchard, N.A., Zapata, G.E., Mehta, N.R., Weis, M.A., Scott, A.A., Tremp, B.A., Phillips, J.B., Wegner, J., Taylor-Miller, T., Gibbs, R.A., Muzny, D.M., Jhangiani, S.N., Hicks, J., Stottmann, R.W., Dickinson, M.E., Seavitt, J.R., Heaney, J.D., Eyre, D.R., Undiagnosed Diseases Network, Westerfield, M., De Matteis, M.A., Lee, B.
- Source
- Full text @ Am. J. Hum. Genet.
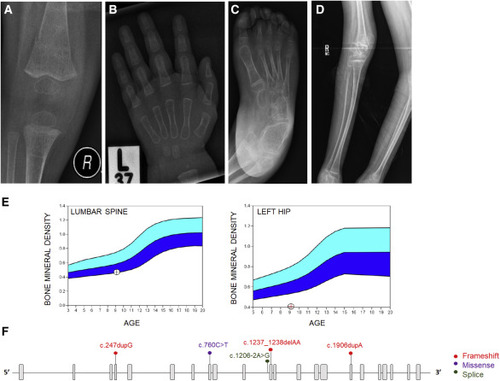
Figure 1. COPB2 variants lead to osteopenia and fractures (A) Right knee radiograph of subject 3 at age 14 months showing fracture of distal femoral metadiaphysis and osteopenia. (B) Left hand radiograph of subject 3 at age 20 months showing thin metacarpal cortices. (C) Right foot radiograph of subject 5 at age 8 years showing diffuse osteopenia and hind-foot varus deformity. (D) Right leg radiographs of subject 6 at age 12 years showing gracile, over-tubulated long bones. (E) Bone densitometry scan in subject 2 showing low bone mineral density of the lumbar spine (left panel) and left hip (right panel). (F) Schematic illustration of COPB2 variants identified in subjects with osteopenia and developmental delay (GenBank: NM_004766.2). |
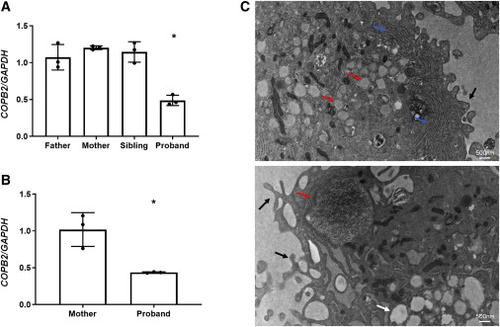
Figure 2. COPB2 haploinsufficiency results in abnormal cellular morphology (A) COPB2 qPCR in lymphoblastoid cells from subject 1 (proband) showing decreased COPB2 expression by about 50% compared to expression in parents and sibling. (B) COPB2 qPCR in skin fibroblasts from subject 2 (proband) and her mother showing decreased COPB2 expression by about 50% compared to expression in parent. Results shown as COPB2/GAPDH relative mRNA expression, ∗p = 0.0002 (one-way ANOVA) for subject 1, and ∗p = 0.002 (t test) for subject 2. (C) Electron microscopy of subject 2 fibroblasts showing dilated ER containing granular matrix (red arrows), prominent rough ER (blue arrows), vacuoles (white arrow), and dominant pseudopodia on the cytoplasmic membrane (black arrows). |
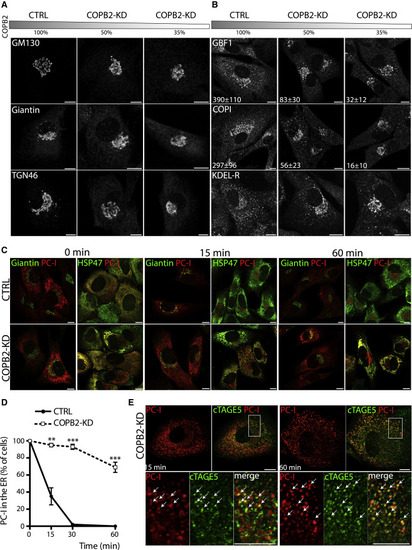
Figure 3. Partial depletion of COPB2 induces disorganization of the Golgi complex and impairs ER exit of PCI in human fibroblasts (A) BJ-5ta human fibroblasts (HFs) were mock (CTRL) or COPB2-siRNA treated for 36 h for obtainment of different levels of COPB2 reduction (to 50% and 35% of control via 20 nM and 100 nM siRNAs, respectively). The gray bar indicates the residual COPB2 protein level after siRNA treatment. Cells were immunolabeled with an antibody against the cis-Golgi marker GM130 (upper panel), medial Golgi marker Giantin (middle panel), and trans-Golgi protein TGN46 (lower panel). Scale bars represent 10 μm. (B) Immunofluorescence analyses of CTRL and COPB2-KD HFs for several proteins of the ER-Golgi intermediate compartment (ERGIC): GBF1, COPI (evaluated with an anti-coatomer mAbCM1A10), and KDEL receptor (all markers in gray). Scale bars represent 10 μm. Numbers represent quantification of GBF1-positive and COPI-positive spots per cell from one representative experiment. N = 3 experiments, n = 50 cells counted, ± SD. (C) PCI transport in human fibroblasts. CTRL and COPB2-KD (50% of residual protein level) cells were shifted to 40°C for 3 h for accumulation of PCI (red) in the ER. Cells were then either fixed immediately (0 min) or incubated for different times (15 and 60 min) at 32°C in the presence of ascorbate and CHX. During the temperature block, both CTRL and COPB2-KD cells accumulate PCI into the ER. In control cells, PCI co-localizes with the Golgi marker Giantin (green) after 15 min but does not in COPB2-KD cells where it fails to exit the ER. PCI and HSP47 co-localized in control and COPB-KD cells at baseline (0 min) and continued to co-localize in COPB2-KD cells (but not in control cells) after 15 and 60 min because of ER retention of PCI. Scale bars represent 10 μm. (D) Quantification of the ER exit of PCI in CTRL and COPB2-KD HFs expressed as percentage of cells with PCI in the ER. N = 3 experiments, n = 100 cells counted. Mean values ± SD (∗∗p < 0.001, ∗∗∗p < 0.0001). (E) PCI transport assay in COPB2-KD human fibroblasts as in (C). Cells were immunolabeled for PCI and cTAGE5 as a marker of the ER exit sites. PCI co-localized with cTAGE5 15 and 60 min after the release. Bottom panels are enlargements of the boxed areas with white arrows indicating the co-localizing PCI with cTAGE5. Scale bars represent 10 μm. |
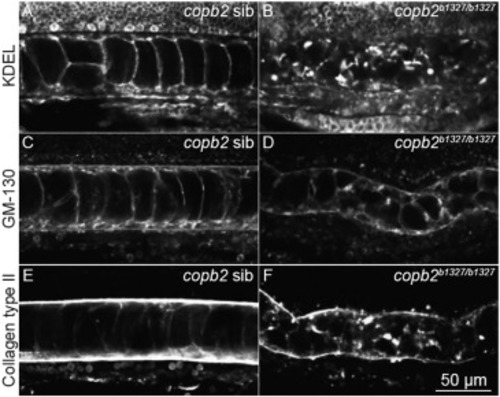
Figure 4. Structural integrity of the ER and Golgi apparatus and protein secretion are compromised in copb2b1327/b1327 zebrafish mutants (A–F) Confocal sections of the notochord. Immunolabeling of KDEL in copb2 siblings (A) and copb2b1327/b1327 mutant (B) embryos. Immunolabeling of GM130 in copb2 siblings (C) and copb2b1327/b1327 mutant (D) embryos. Immunolabeling of type II collagen in copb2 siblings (E) and copb2b1327/b1327 mutant (F) embryos (anterior is to the left and dorsal to the top). Images were taken at the level of the yolk extension at 30 hpf. |

Figure 5. Copb2 heterozygous mice exhibit low bone mass phenotype (A) Micro-CT analysis of spine showed significant decrease in bone architectural parameters in Copb2+/− mice (Het), including the bone volume/total volume (BV/TV, p = 0.014 for males, p = 0.0006 for females) and trabecular thickness (p = 0.007 for males, p < 0.0001 for females). Females also showed decreased trabecular number (p = 0.002). (B) Micro-CT analysis of femurs showed mild reduction in cortical thickness in the females (p = 0.003). Mean values ± SD are indicated for both (A) and (B) (∗p < 0.05, ∗∗p < 0.001). |
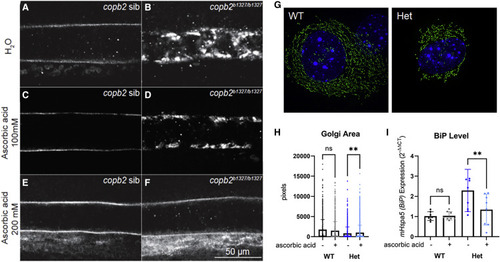
Figure 6. Secretion of collagen type II in copb2b1327/b1327 zebrafish mutants and ER/Golgi defects in Copb2+/− mouse fibroblasts can be rescued by treatment with ascorbic acid (A–F) Confocal sections of zebrafish notochords (anterior is to the left and dorsal to the top, images were taken at the level of the yolk extension at 30 hpf). Immunolabeling of type II collagen in untreated copb2 siblings (A) and copb2b1327/b1327 (B) embryos, 100 mM ascorbic acid-treated copb2 siblings (C) and copb2b1327/b1327 embryos (D), and 200 mM ascorbic acid-treated copb2 siblings (E) and copb2b1327/b1327 embryos (F). See Figure S9 for quantification of the distribution of phenotypes in zebrafish. (G) Representative image of Copb2+/− mouse fibroblasts (Het) and wild-type littermate control cells (WT) labeled by CellLight Golgi-GFP reagent for visualization of Golgi structure. (H) Graph summarizing multiple single-cell measurements of Golgi area with or without ascorbic acid (n = 1,631/1,723 Het cells −/+ ascorbic acid treatment and n = 1,021/1,152 WT cells −/+ treatment). (I) BiP/mHspa5 expression in Copb2+/− mouse fibroblasts (Het, n = 3) and wild-type littermate control cells (WT, n = 2) with or without ascorbic acid. Results are presented as mean values ± SD, summary of three independent experiments. ∗∗p = 0.002. |

ZFIN is incorporating published figure images and captions as part of an ongoing project. Figures from some publications have not yet been curated, or are not available for display because of copyright restrictions. |
|
ZFIN is incorporating published figure images and captions as part of an ongoing project. Figures from some publications have not yet been curated, or are not available for display because of copyright restrictions. PHENOTYPE:
|
|
Unillustrated author statements PHENOTYPE:
|