
Fig. 7
- ID
- ZDB-FIG-221004-44
- Publication
- Hadjiabadi et al., 2021 - Maximally selective single-cell target for circuit control in epilepsy models
- Other Figures
- All Figure Page
- Back to All Figure Page
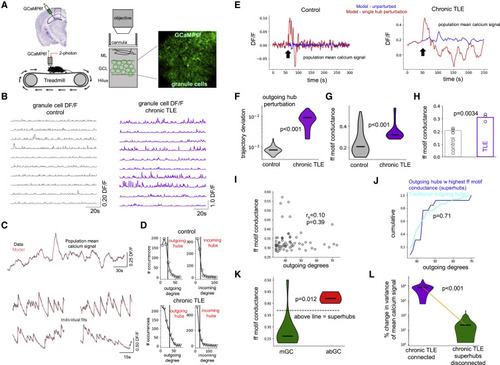
Figure 7. Superhubs in the intrahippocampal kainic acid mouse model of chronical temporal lobe epilepsy (A) Experimental setup. Control and chronically epileptic mice were virally injected with GCaMP in dentate gyrus (DG) and imaged with two-photon (2p) microscope. (B) DG granule cell DF/F for control and chronically epileptic mouse. (C) Model fits of experimentally recorded granule cells from chronically epileptic granule mouse using FORCE learning. (D) Outgoing and incoming degree distributions for modeled control dentate and chronically epileptic dentate networks showing heavy-tailed distributions. (E) Network response to perturbation (black arrows) of a single outgoing hub neuron in a modeled control (left) and modeled chronically epileptic (right) network. (F) Trajectory deviation in response to perturbation of individual outgoing hubs is significantly higher (one-sided Mann-Whitney U test, p < 0.001) in modeled chronically epileptic dentate network (purple, N = 28 modeled cells) than in modeled control network (gray; N = 59 modeled cells). Center marker of the violin plot represents the median. (G) Feedforward motif conductance of individual outgoing hubs is significantly higher (one-sided Mann-Whitney U test, p < 0.001) in modeled chronically epileptic dentate network (purple, N = 27 modeled cells) than in modeled control network (gray; N = 49 modeled cells). Center marker of the violin plot represents the median. (H) Feedforward motif conductance is significantly increased in modeled chronically epileptic networks across the sample population (one-sided unpaired t test, p = 0.0034). Bar graphs represents the mean of the population (N = 3 mice). (I) Outgoing degrees and feedforward motif conductance are not significantly correlated (Spearman's rho = 0.10, p = 0.39; N = 49 modeled neurons). (J) Outgoing degree cumulative distribution for superhubs (N = 8 modeled cells) versus traditional outgoing hubs (N = 19 modeled cells). Superhubs did not have the highest outgoing degrees (one-sided KS-test, p = 0.71). (K) Feedforward motif conductance of adult-born granule cells (red; N = 6 modeled cells) is significantly greater than mature granule cells (green; N = 21 modeled cells) (one-sided Mann-Whitney U test, p = 0.012). Dashed line represents cutoff for superhub status. Center marker of the violin plot represents the median. (L) Disconnecting all superhubs simultaneously significantly reduced the response of a modeled chronically epileptic dentate network to single outgoing hub perturbation, as measured by the percentage change in global signal variance (one-sided Wilcoxon signed-rank test, p < 0.001; N = 27 modeled cells). Center marker of the violin plot represents the median. See also Figure S7. |