
Fig. 2
- ID
- ZDB-FIG-221004-39
- Publication
- Hadjiabadi et al., 2021 - Maximally selective single-cell target for circuit control in epilepsy models
- Other Figures
- All Figure Page
- Back to All Figure Page
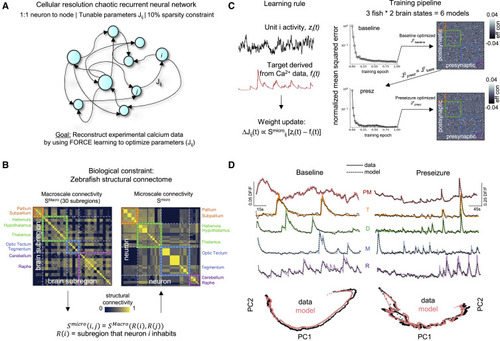
Figure 2. Cellular resolution effective connectivity modeling to extract cell-cell communication networks (A) Cellular resolution chaotic recurrent neural network (RNN) with 10% sparsity constraint to prevent overfitting. Each neuron imaged in the larval zebrafish is represented as a node in the RNN. Edges represent parameters of the model and were optimized with FORCE learning to match experimental calcium data. (B) The zebrafish structural connectome was incorporated as a biological constraint. Left: zebrafish macroscale connectivity matrix (SMacro). Right: zebrafish microscale connectivity (Smicro), which represents the strength of connectivity between the regions in which neurons i and j occupy. (C) Learning rule: FORCE learning tunes the weight Jij between neuron i (target) and j (source). The update is proportional to the structural connectivity score Smicroij, multiplied by the difference between unit activity of node i (black trace) and target Ca2+ waveform acquired experimentally (red trace). Training pipeline: models converged using the weight update that incorporated the structural connectome. The baseline model was trained on baseline calcium dynamics with an initial random matrix. To map the changes to the underlying microcircuit connectivity resulting from bath wash in of PTZ, the optimized parameters of the baseline model were then used as the seed for training the preseizure model on preseizure calcium dynamics. See also Figure S1. (D) Representative examples of mean population Ca2+ trace and individual Ca2+ traces with modeled fits overlaid for baseline (left) and preseizure (right) dynamics. Note the scale bars. Bottom: principal-component analysis (PCA) of experimental (black) and modeled (red) calcium activity. PM, population mean; T, telencephalon; D, diencephalon; M, mesencephalon; R, rhombencephalon. See also Figure S2. |