
Fig. 7
- ID
- ZDB-FIG-220829-236
- Publication
- Rea et al., 2022 - Gut-derived metabolites influence neurodevelopmental gene expression and Wnt signaling events in a germ-free zebrafish model
- Other Figures
- All Figure Page
- Back to All Figure Page
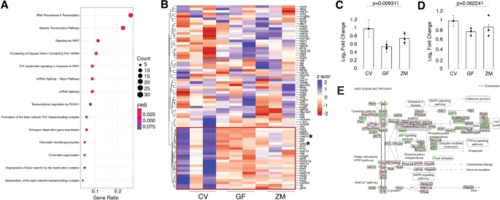
Metabolites affect Wnt signaling. A Enriched pathway analysis of the downregulated genes in the GF group via KEGG profile. B Heatmap of 75 Wnt/β-catenin signaling genes identified by the Wnt signaling community. Box in red shows genes that are affected in our dataset. Asterisks identify two genes that were validated by RT-qPCR (C, sp5 and D, ctnnb2; one-way ANOVA of all 3 group standard weighted mean analysis, 3 independent samples, 2 degrees of freedom, total p value is as stated, error bars represent SEM). E KEGG profile output of Wnt pathway and genes from complete RNA-Seq dataset. Expression levels are shown in red where the left side (CV) is arbitrarily set to 0, the middle point is GF, and the right point is ZM |