
- Title
-
Gut-derived metabolites influence neurodevelopmental gene expression and Wnt signaling events in a germ-free zebrafish model
- Authors
- Rea, V., Bell, I., Ball, T., Van Raay, T.
- Source
- Full text @ Microbiome
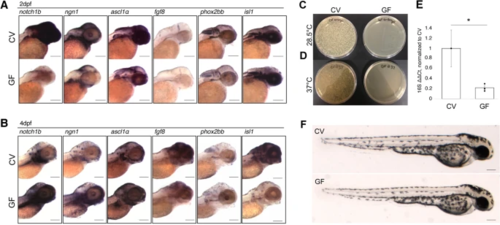
Microbes are necessary for timely neural gene expression. A WMISH of target genes in conventionally raised (CV) and germ-free (GF) embryos at 2dpf. RNA expression of target genes notch1b (N = 6) ngn1 (N = 3), ascl1a (N = 2), fgf8 (N = 6), and phox2bb (N = 1) is reduced in the absence of microbes at 2dpf. Expression of isl1 (N = 3) shows no appreciable difference between groups. B WMISH of target genes in conventionally raised and germ-free embryos at 4dpf. RNA expression of target genes notch1b (N = 4), ngn1 (N = 2), and ascl1a (N = 1) shows an increase in expression in the GF group compared to their CV counterparts at 4dpf. Expression of fgf8 (N = 2) and phox2bb (N = 2) remains reduced in comparison to the CV group C, D Whole homogenized single CV (left) or GF (right) embryos plated on brain heart infusion media and left at C 28.5°C or D 37°C for 24 h. E RT-qPCR analysis of universal 16S rRNA gene in CV and GF embryos (* = p < 0.05 in a one-way ANOVA, based on delta, delta Ct), normalized to ef1α (error bars represent SEM). RNA was extracted from a pool of five embryos for each group and experiment was conducted in triplicate. F Live images of 2dpf zebrafish embryos for morphological comparison. N values represent the number independent biological replicates each of which contained approximately 8–10 embryos. Scale bars represent 100um |
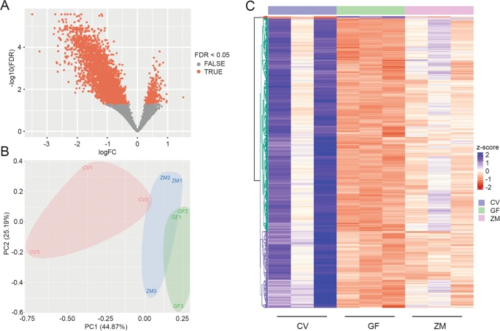
Microbes are both necessary and sufficient for general gene expression in the developing nervous system. A Volcano plot comparing DEGs between germ-free larvae and conventionally raised larvae. B Principal component (PC) analysis of count data from CV, GF, and ZM zebrafish larvae at 2dpf. Numbers 1, 2, and 3 represent the biological replicates. C Heatmap of top 1000 differentially expressed genes between 3 biological replicates of CV, GF, and GF treated with zebrafish gut metabolites (ZM) embryos at 2dpf. Generated with DeSeq2 and ComplexHeatmap |
|
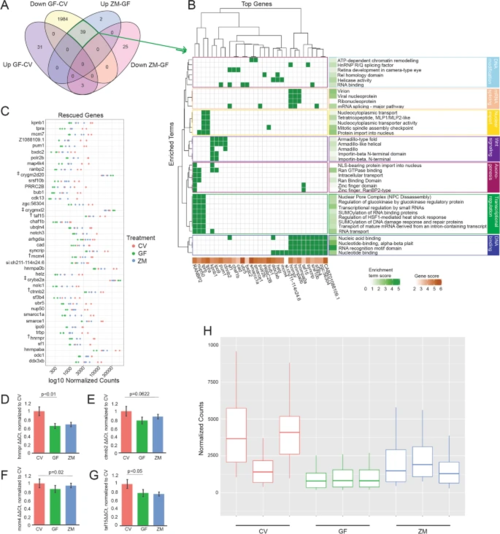
Metabolites are sufficient to rescue neural gene expression in GF larva. A Venn-diagram comparing gene expression levels between CV and GF and those rescued by the addition of zebrafish metabolites to GF embryos (ZM-GF) (p < 0.05; GF-CV FDR < 0.05, ZM-GF FDR < 0.1). B DAVID generated plot of 31 of the 39 rescued genes and their associated enrichment terms (note: 8 genes did not contribute to significant over representation in DAVID output). Enrichment terms largely fall within seven major biological processes noted on the right. C Normalized counts of all 42 genes (39 downregulated plus 3 upregulated, noted by ‡ ) whose expression was rescued with metabolite treatment. Count comparison and RT-qPCR validation (D–G) of four rescued genes (marked with † in C from the RNA-seq dataset. RT-qPCR validation of hnrnpr (D), ctnnb2 (E), mcm4 (F), and taf15 (G) (one-way ANOVA of all 3 groups’ standard weighted mean analysis, 3 independent samples, 2 degrees of freedom, total p value is as stated, error bars represent SEM). H Boxplot of normalized counts of 39 downregulated and rescued genes between treatment groups with outliers removed. Top and bottom of box represents the 75th and 25th percentile respectively. The 50th percentile and solid horizontal line in the box represents the median. Whiskers represent the largest and smallest value within 1.5 times interquartile range above 75th percentile and below 25th percentile, respectively 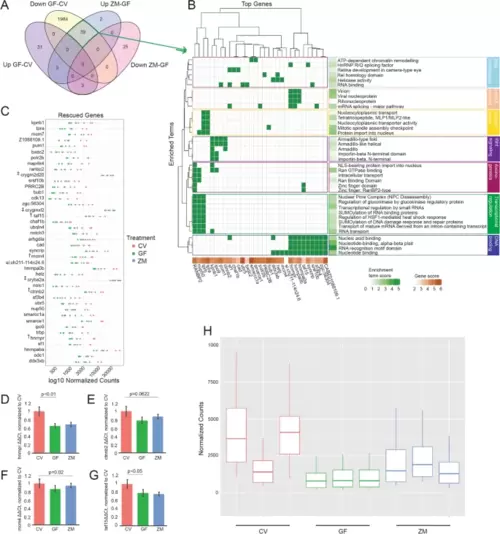
|
|
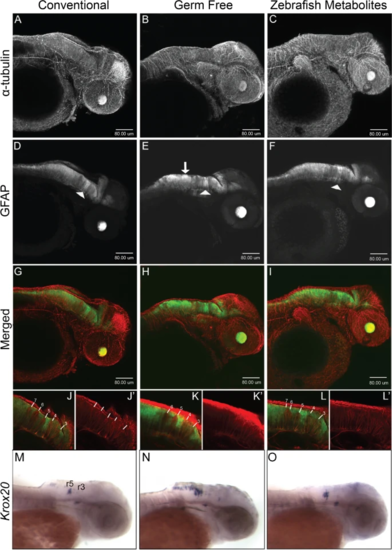
Neural development is disrupted in germ-free embryos. Confocal projection images of zebrafish embryos at 2dpf. A–C α-tubulin immunostaining. D–F GFAP:GFP fluorescence displays a non-uniform distribution in the hindbrain in germ free embryos (white arrow in E) and to some extent in ZM-treated embryos. The white arrowheads identify the GFAP tract between rhombomeres 4 and 5 which do not appear to be significantly altered in germ-free embryos. G–I Merged images of α-tubulin and GFAP to GFP. J–L Representative single-layer images of regions in the hindbrain. In conventional embryos, rhombomere tracts, 3–7 are readily identifiable by the relative absence of GFAP fluorescence. The higher intensity GFP to GFAP fluorescence between rhombomeres 4 and 5 provides a landmark for their easy identification. Note the absence of rhombomere 7 in germ-free embryos, and the seemingly merged tracts 6 and 7 in ZM-treated embryos. More examples are presented in Supplementary Figs. 5 and 6. M-O WMISH of krox20 in 2dpf embryos from CV (M), GF (N) and ZM treated (O) embryos. Rhombomeres 3 (r3) and 5 (r5) are labelled. Larvae from each treatment group were processed in parallel 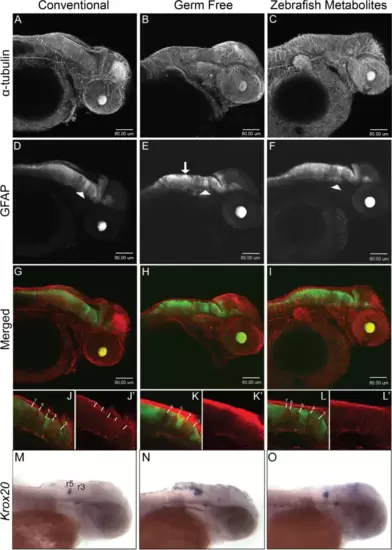
|
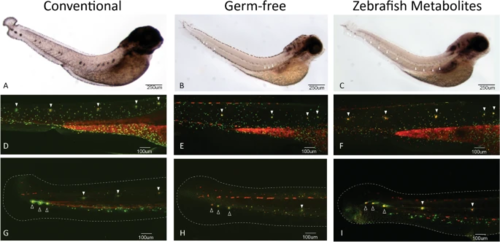
Posterior lateral line development is disrupted in germ-free embryos. A–C WMISH of isl1 in 4dpf embryos. Larvae from each treatment group were processed in parallel. All groups were stained for the same period of time to allow comparison of GF and ZM groups which have reduced staining, but visible neuromasts (white arrowheads). Experiment was conducted with 8–10 larvae per group. D–F Trunk neuromasts of the posterior lateral line in 3dpf larvae incubated in a mixture of vital dyes Diasp and DiOC6 to identify hair cells (red) and accessory cells (green) of the lateral line. Neuromasts are marked with white arrowheads. The intense staining in the yolk extension provides a useful positioning reference. G–I Posterior trunk neuromasts (solid white arrowheads) and terminal neuromasts (hollow arrowheads) in the tail identified with Diasp and DiOC6 in 3dpf. Tail fins are outlined with dashed line for reference. Terminal neuromasts appear to be smaller and less well-developed in GF larvae. Some neuromasts of the posterior tail, as well as some terminal neuromasts, are missing in GF larvae. More examples are presented in Supplementary Figs. 8, 9 and 10 |
|
Development of terminal neuromasts is disrupted in germ-free embryos. Scanning electron microscopy of terminal neuromasts of 3dpf larvae. A Tail of a CV larvae. B Tail of GF larvae. i–iii Representative individual terminal neuromasts of CV 3dpf larvae (scale bars = 5um). iv–vi Representative individual terminal neuromasts of GF 3dpf larvae (scale bars = 5um). Terminal neuromasts of CV larvae had an average aperture diameter of 3.44um, which was significantly larger (p<0.01, Student’s t test) than GF larvae, which had an average aperture diameter of 2.69 um (standard deviations 0.74 and 0.84, respectively). Average aperture area was also significantly larger (p<0.01, Student’s t test) in CV larvae at 8.64um compared to an average of 5.00um in the GF group (standard deviations 3.52 and 2.93, respectively) (22 neuromasts imaged from 8 larvae in the CV group, 14 neuromasts from 6 larvae in the GF group) 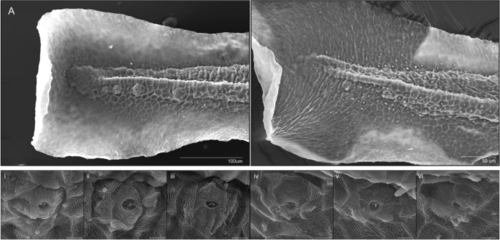

|
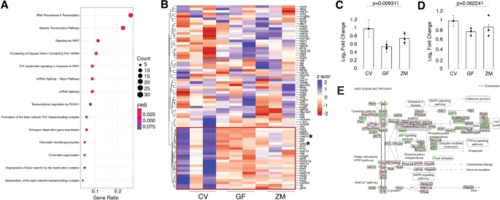
Metabolites affect Wnt signaling. A Enriched pathway analysis of the downregulated genes in the GF group via KEGG profile. B Heatmap of 75 Wnt/β-catenin signaling genes identified by the Wnt signaling community. Box in red shows genes that are affected in our dataset. Asterisks identify two genes that were validated by RT-qPCR (C, sp5 and D, ctnnb2; one-way ANOVA of all 3 group standard weighted mean analysis, 3 independent samples, 2 degrees of freedom, total p value is as stated, error bars represent SEM). E KEGG profile output of Wnt pathway and genes from complete RNA-Seq dataset. Expression levels are shown in red where the left side (CV) is arbitrarily set to 0, the middle point is GF, and the right point is ZM |
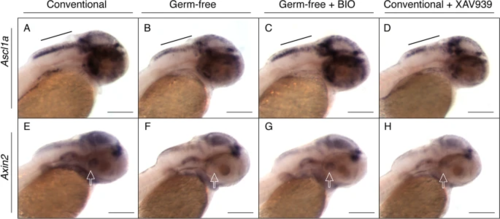
Specific regulation of Wnt signaling mimics the GF and ZM conditions. Representative images of whole mount in situ hybridization on 2 dpf conventional embryos, germ-free embryos, germ-free embryos treated with known Wnt activator BIO, and conventional embryos treated with known Wnt inhibitor XAV939 for genes ascl1a (A–D) and axin2 (E–H). All embryos were treated in parallel and stained for the same period of time. Black bar identifies the hindbrain region where there is less staining in both the GF and conventional treated with Wnt inhibitor than the CV or GF treated with Wnt activator. Hollow white arrows represent the posterior recess of the hypothalamus [41, 42]. Experiment was conducted using 8–10 embryos per group. Scale bars represent 100um |