
Fig. 5
- ID
- ZDB-FIG-220817-23
- Publication
- Adant et al., 2022 - Pyruvate and uridine rescue the metabolic profile of OXPHOS dysfunction
- Other Figures
- All Figure Page
- Back to All Figure Page
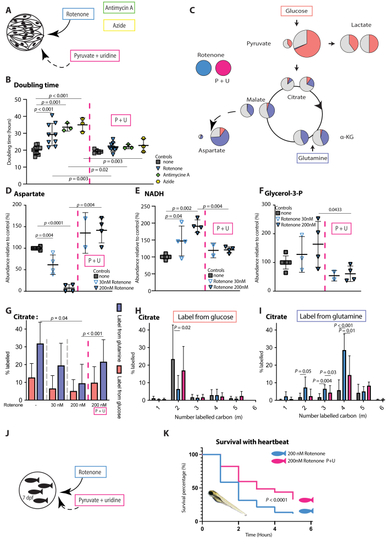
Combination of pyruvate and uridine rescues rotenone induced OXPHOS dysfunction in fibroblasts and zebrafish models A Rotenone, antimycin A and azide model of OXPHOS dysfunction in control fibroblast, treated by 1 mM pyruvate and 200 μM uridine. B Doubling time of control fibroblasts exposed to with 200 nM rotenone (n. = 9), 1 μM antimycin A (n = 3) and 500 μM azide (n = 3) with the effect of pyruvate + uridine supplementation thereon. Doubling time based on 72-hours IncucyteⓇ proliferation experiments (technical replicates >3 per cell line) with calculation over a 48-hour period starting 24 h after plating. C Tracer based metabolomics results from fibroblasts cultured with U–13C glucose or U–13C5 glutamine. A simplified map of glycolysis and TCA cycle is depicted. The area of the circles represents the relative abundance of the metabolite compared to average control. Pink, blue and grey colour represent the fractional labelling coming from glucose, glutamine or other sources, respectively. A comparison of rotenone OXPHOS dysfunction (left) with and without pyruvate-uridine treatment (right) is shown. D The relative abundances of aspartate, E NADH and F glycerol-3-phosphate in controls, 30 nM and200 nM rotenone induced OXPHOS dysfunction and pyruvate-uridine treatment in the 30 nM and200 nM rotenone groups. G Fractional carbon contribution of citrate in control, 30 nM and 200 nM rotenone induced OXPHOS dysfunction and pyruvate-uridine treatment in the 200 nM rotenone group. Fibroblasts cell lines cultured with U–13C glucose or U–13C glutamine. H Comparison of the 6 isotopologues in citrate in control, 200 nM rotenone induced OXPHOS dysfunction wit and without pyruvate-uridine treatment; fibroblasts cell lines cultured with U–13C glucose or I U–13C glutamine. J Pharmacological inhibition of OXPHOS by exposing 7 days old zebrafish larvae to 200 nM rotenone for 6 h. K Heartbeat based survival curve comparing the 200 nM rotenone zebrafish model with and without coincubation with 25 mM pyruvate and 25 mM uridine. Mantel–Cox test for curve comparison; > 100 larvae per group. Unless otherwise specified, statistics: one-way ANOVA with post-hoc Dunnett's T3 multiple comparison tests, effect of treatment was assessed using paired student T-tests comparing no treatment with a treatment and the error bars are +/−SD. αKG: alpha-ketoglutarate; dpf: days post fertilisation; Glycerol-3-P: Glycerol-3-phosphate; OXPHOS: oxidative phosphorylation system; PDH: pyruvate dehydrogenase; P + U: pyruvate + uridine. |
| Fish: | |
|---|---|
| Conditions: | |
| Observed In: | |
| Stage: | Days 7-13 |