
- Title
-
Pyruvate and uridine rescue the metabolic profile of OXPHOS dysfunction
- Authors
- Adant, I., Bird, M., Decru, B., Windmolders, P., Wallays, M., de Witte, P., Rymen, D., Witters, P., Vermeersch, P., Cassiman, D., Ghesquière, B.
- Source
- Full text @ Mol Metab
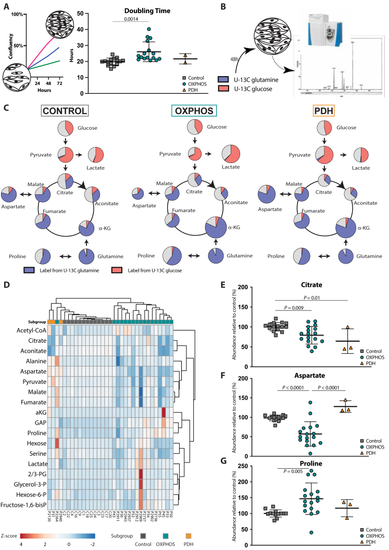
Metabolic profile of mitochondrial disease A Design of the fibroblast proliferation assays based on 72-hours IncucyteⓇ proliferation experiments. Doubling time was calculated over a 48-hour period starting 24 h after plating (control (n = 15), OXPHOS deficient (n = 17) and PDH deficient (n = 3) fibroblast cell lines; technical replicates >3 per cell line). B Design of the tracer-based metabolomics studies with cultures with U–13C glucose or U–13C glutamine. C A simplified map of glycolysis and TCA cycle is depicted. The area of the circles represents the relative abundance of the metabolite compared to average control. Pink, blue and grey colour represent the fractional labelling coming from U–13C glucose, U–13C glutamine or other sources, respectively. D Heatmap displaying the changes in metabolite relative abundances of glycolysis, TCA and linked amino acids relative to controls in the different fibroblast cell lines. The colour scale (blue to red) corresponds to the z-score value of the relative abundance of the metabolite. Grouping of the different cell lines into disease subgroups is annotated with different colours: |
 OXPHOS deficiency;
  PDH deficiency and
  controls. Full description of the genetic deficiency per cell line is described in
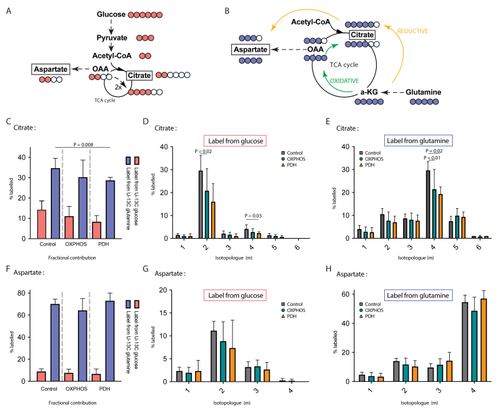
TCA alterations in OXPHOS dysfunction A Schematic representation of anaplerotic glucose flux into the TCA cycle metabolites with cataplerotic efflux and conversion into aspartic acid. The circles represent the number of carbons, with pink filled circles the number of labelled carbons coming from fully labelled U–13C glucose. B Schematic representation of anaplerotic glutamine flux into the TCA cycle metabolites with cataplerotic efflux and conversion into aspartic acid. The circles represent the number of carbons, with blue filled circles the number of labelled carbons coming from fully labelled glutamine. C Fractional carbon labelling data of citrate in control, OXPHOS deficient and PDH deficient fibroblasts cell lines cultured with U–13C glucose or U–13C glutamine. D Comparison of the 6 isotopologues of citrate in control, OXPHOS deficient and PDH deficient fibroblasts cell lines cultured with U–13C glucose or E U–13C glutamine. F Fractional carbon labelling data of aspartate in control, OXPHOS deficient and PDH deficient fibroblasts cell lines cultured with U–13C glucose or U–13C glutamine. G Comparison of the 4 isotopologues of aspartate in control, OXPHOS deficient and PDH deficient fibroblasts cell lines cultured with U–13C glucose or H U–13C glutamine. Tracer metabolomics in control (n = 15), OXPHOS deficient (n = 17) and PDH deficient (n = 3) fibroblast cell lines (technical replicates 1–3 per cell line). Abundances normalized for protein content (BCA) and to the average of the controls per experiment. Statistics: one-way ANOVA with post-hoc Dunnett's T3 multiple comparison tests, and the error bars are +/−SD. a-KG: alpha-ketoglutarate; CoA: coenzyme A; OAA: oxaloacetate; OXPHOS: oxidative phosphorylation system; PDH: pyruvate dehydrogenase; TCA: tricarboxylic acid. |

Metabolic profile of OXPHOS dysfunction is linked to NAD+/NADH imbalance. A The relative intracellular abundances of lactate and B pyruvate in control, OXPHOS deficient and PDH deficient fibroblasts. C The relative excretion of lactate in medium in control (n = 5), OXPHOS deficient (n = 7) and PDH deficient (n = 1) fibroblast. D Fractional labelling in lactate and E pyruvate coming from U–13C glucose in control, OXPHOS deficient and PDH deficient fibroblasts. F Schematic representation of the central carbon metabolic reactions using NAD+/NADH as cofactors. Thickness of the arrows and the size of the metabolites indicate the magnitude of alteration in OXPHOS deficient fibroblasts compared to control. G The relative intracellular abundances of NAD+ and H NADH in control, OXPHOS deficient and PDH deficient fibroblasts. I The relative intracellular abundance of aKG and J the fractional labelling in aKG coming from U–13C glutamine in control, OXPHOS deficient and PDH deficient fibroblasts. K The relative intracellular abundance of Glycerol-3-P and L the fractional labelling in Glycerol-3-P coming from U–C glucose in control, OXPHOS deficient and PDH deficient fibroblasts. Unless otherwise specified, tracer metabolomics in control (n = 15), OXPHOS deficient (n = 17) and PDH deficient (n = 3) fibroblast cell lines (technical replicates 1–3 per cell line). Abundances normalized for protein content (BCA) and to the average of the controls per experiment. Statistics: one-way ANOVA with post-hoc Dunnett's T3 multiple comparison tests, and the error bars are +/−SD. a-KG: alpha-ketoglutarate; CoA: coenzyme A; Glycerol-3-P: glycerol-3-phosphate; OAA: oxaloacetate; OXPHOS: oxidative phosphorylation system; PDH: pyruvate dehydrogenase; TCA: tricarboxylic acid. |
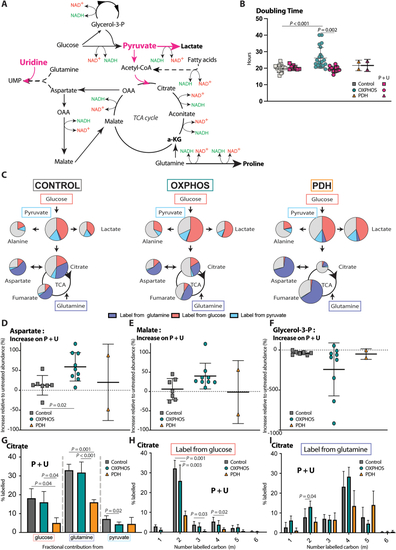
1 mM Pyruvate and 200 μM uridine supplementation rescues the metabolic consequences of OXPHOS dysfunction in fibroblasts. A Schematic representation of the central carbon metabolic reactions using NAD+/NADH as cofactors depicting the treatment mechanisms of pyruvate + uridine. Thickness of the arrows and the size of the metabolites indicate the magnitude of alteration in OXPHOS deficient fibroblasts compared to control. B Effect of pyruvate + uridine supplementation on the doubling time, based on 72-hours IncucyteⓇ proliferation experiments (Controls n = 8; OXPHOS deficient n = 11; PDH deficient n = 2; technical replicates >3 per cell line) with calculation of doubling time over a 48-hour period starting 24 h after plating. C Tracer metabolomics faith of glucose, glutamine and pyruvate in 1 mM pyruvate and 200 μM uridine supplemented cultures of controls, OXPHOS and PDH deficient fibroblasts with U–13C glucose, U–13C glutamine or U–13C pyruvate. A simplified map of glycolysis and TCA cycle is depicted. The area of the circles represents the relative abundance of the metabolite compared to average control. Pink, dark blue, light blue and grey colour represent the fractional labelling coming from glucose, glutamine, pyruvate or other sources, respectively. D The relative change in abundances of aspartate, E malate and F glycerol-3-phosphate in controls, OXPHOS deficient and PDH deficient fibroblasts upon supplementation with 1 mM pyruvate and 200 μM uridine. G Fractional carbon labelling of citrate in control, OXPHOS deficient and PDH deficient fibroblasts cell lines supplemented with 1 mM pyruvate and 200 μM uridine, cultured with U–13C glucose, U–13C glutamine or U–13C pyruvate. H Comparison of the 6 isotopologues of citrate in control, OXPHOS deficient and PDH deficient fibroblasts cell lines cultured with U–13C glucose or I U–13C glutamine after supplementation with 1 mM pyruvate and 200 μM uridine. Tracer metabolomics in control (n = 8), OXPHOS deficient (n = 9) and PDH deficient (n = 2) fibroblast cell lines (technical replicates 1–3 per cell line). Abundances normalized for protein content (BCA) and to the average of the controls per experiment. Statistics: one-way ANOVA with post-hoc Dunnett's T3 multiple comparison tests, effect of treatment was assessed using paired student T-tests comparing no treatment with a treatment and the error bars are +/−SD. αKG: alpha-ketoglutarate; dpf: days post fertilisation; Glycerol-3-P: Glycerol-3-phosphate; OXPHOS: oxidative phosphorylation system; PDH: pyruvate dehydrogenase; P + U: 1 mM pyruvate +200 μM uridine. |
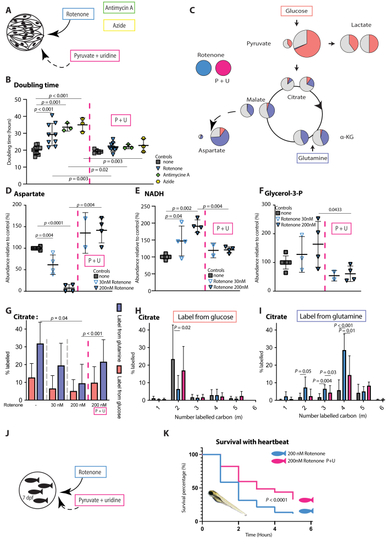
Combination of pyruvate and uridine rescues rotenone induced OXPHOS dysfunction in fibroblasts and zebrafish models A Rotenone, antimycin A and azide model of OXPHOS dysfunction in control fibroblast, treated by 1 mM pyruvate and 200 μM uridine. B Doubling time of control fibroblasts exposed to with 200 nM rotenone (n. = 9), 1 μM antimycin A (n = 3) and 500 μM azide (n = 3) with the effect of pyruvate + uridine supplementation thereon. Doubling time based on 72-hours IncucyteⓇ proliferation experiments (technical replicates >3 per cell line) with calculation over a 48-hour period starting 24 h after plating. C Tracer based metabolomics results from fibroblasts cultured with U–13C glucose or U–13C5 glutamine. A simplified map of glycolysis and TCA cycle is depicted. The area of the circles represents the relative abundance of the metabolite compared to average control. Pink, blue and grey colour represent the fractional labelling coming from glucose, glutamine or other sources, respectively. A comparison of rotenone OXPHOS dysfunction (left) with and without pyruvate-uridine treatment (right) is shown. D The relative abundances of aspartate, E NADH and F glycerol-3-phosphate in controls, 30 nM and200 nM rotenone induced OXPHOS dysfunction and pyruvate-uridine treatment in the 30 nM and200 nM rotenone groups. G Fractional carbon contribution of citrate in control, 30 nM and 200 nM rotenone induced OXPHOS dysfunction and pyruvate-uridine treatment in the 200 nM rotenone group. Fibroblasts cell lines cultured with U–13C glucose or U–13C glutamine. H Comparison of the 6 isotopologues in citrate in control, 200 nM rotenone induced OXPHOS dysfunction wit and without pyruvate-uridine treatment; fibroblasts cell lines cultured with U–13C glucose or I U–13C glutamine. J Pharmacological inhibition of OXPHOS by exposing 7 days old zebrafish larvae to 200 nM rotenone for 6 h. K Heartbeat based survival curve comparing the 200 nM rotenone zebrafish model with and without coincubation with 25 mM pyruvate and 25 mM uridine. Mantel–Cox test for curve comparison; > 100 larvae per group. Unless otherwise specified, statistics: one-way ANOVA with post-hoc Dunnett's T3 multiple comparison tests, effect of treatment was assessed using paired student T-tests comparing no treatment with a treatment and the error bars are +/−SD. αKG: alpha-ketoglutarate; dpf: days post fertilisation; Glycerol-3-P: Glycerol-3-phosphate; OXPHOS: oxidative phosphorylation system; PDH: pyruvate dehydrogenase; P + U: pyruvate + uridine. PHENOTYPE:
|