
Fig. 7
- ID
- ZDB-FIG-220809-14
- Publication
- Jia et al., 2022 - Monosynaptic targets of utricular afferents in the larval zebrafish
- Other Figures
- All Figure Page
- Back to All Figure Page
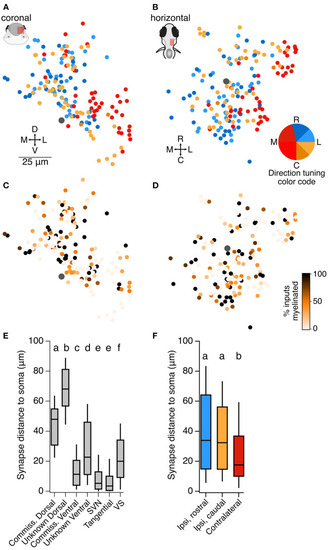
Organization of central utricular neurons by inferred directional tuning. (A) Summary of the inferred directional tuning of all neurons described here in the coronal plane. The Mauthner cell body is indicated by a large gray dot. Neurons predicted to respond to contralateral tilt (reds) are on average located more laterally than those responsive to ipsilateral tilt, Wilcoxon-Mann-Whitney test, p = 1.0 × 10⁻⁹. (B) As in (A), in the horizontal plane. Neurons predicted to respond to contralateral tilt are on average located more ventrally, Wilcoxon-Mann-Whitney test, p = 0.007. (C) Summary of the fraction of inputs that arise from myelinated vs. unmyelinated utricular afferents for all neurons described here. Darker colors represent more input from myelinated afferents (scale in D). Mauthner cell is indicated by a large gray dot. There is no apparent spatial organization of neurons receiving more or less myelinated input, although central neurons with myelinated axons receive more input from myelinated afferents (see Discussion). (D) As in (C), in the horizontal plane. (E) The average distance of utricular synaptic contacts from the soma, measured along the dendrite, for each of the classes of neurons described here. Dorsally located somata receive utricular synaptic input at a longer distance from the soma than ventrally located somata of the same class (compare commissural dorsal and ventral neurons, and unknown dorsal and ventral neurons). Box plot displays median and 25–75th % iles; whiskers are 10–90th % iles. Small lettering above bars represents statistical relationships. Although most groups are significantly different from each other, the differences in values are modest in most cases, with the exception of the dorsal and ventral populations. Pairwise comparisons for these groups: Wilcoxon-Mann-Whitney between commissural dorsal and commissural ventral (Figure 2), p = 4 × 10⁻¹⁰; between unknown dorsal and unknown ventral (Figures 3, ,4),4), p = 0. (F) The average distance of utricular synaptic contacts from the soma, measured along the dendrite, for central neurons separated by their inferred utricular tuning (not including SVN, tangential, and VS neurons). Neurons with inferred contralateral tilt sensitivity (red) received input significantly closer to the soma than neurons with inferred ipsilateral tilt sensitivity (blue, yellow). Small lettering above bars represents statistical relationships. Kruskal-Wallis test among all three groups, p = 0.005. Wilcoxon-Mann-Whitney tests between ipsi-rostral and ipsi-caudal groups, p = 0.35; between ipsi-rostral and contralateral, p = 0.002; between ipsi-caudal and contralateral, p = 0.005. |