
- Title
-
Monosynaptic targets of utricular afferents in the larval zebrafish
- Authors
- Jia, Y., Bagnall, M.W.
- Source
- Full text @ Front Neurol
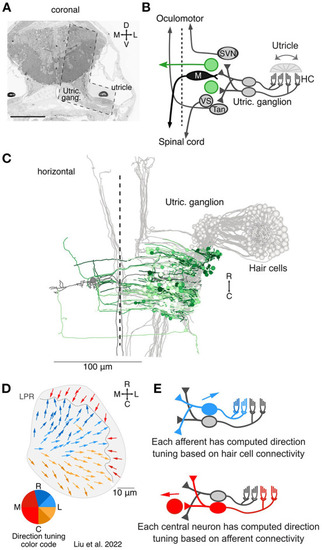
Overview of the central targets of utricular afferents. (A) Coronal section of 5.5 dpf larval zebrafish showing the total area imaged originally by Hildebrand et al. (18) and the area re-imaged at 4 × 4 × 60 nm3 per voxel (L shaped, dashed outline). This area was re-imaged across 105 μm in the rostrocaudal axis (1,757 coronal sections). Scale bar, 100 μm. Reprinted from (19). (B) Circuit schematic highlighting the central vestibular targets described here (green) in the context of the utricular / motor circuit (gray). We identified both commissurally-projecting central neurons and neurons whose axon could not be traced extensively. (C) Horizontal projection of the utricular circuit. As in (B), greens represent neurons described here and grays represent neurons described in Liu et al. (19). Dashed line represents midline. Utricular afferent somata are in the utricular ganglion. (D) Directional tuning of all 91 hair cells in the utricular macula, horizontal view. Each vector represents the best direction of tilt responsiveness, as inferred from the positions of the kinocilium and stereocilia. To facilitate visualization, the directional tuning is also encoded with a color scheme, lower left. Tuning for ipsilateral and rostral tilt is shown in blue, for ipsilateral and caudal tilt in yellow, and contralateral tilt in red. The directional representation is slightly asymmetric to accommodate the patterns of the hair cells. LPR, line of polarity reversal. Data from Liu et al. (19). (E) Schematic of computed tuning for afferents and central neurons. Afferent tuning was computed as a weighted circular average based on the number of ribbon synaptic inputs from hair cells. Central neuron tuning was in turn computed as a weighted circular average based on the number of afferent synaptic contacts. We note that these directional tuning responses only take into account monosynaptic, utricular inputs, not canal inputs or polysynaptic pathways. |
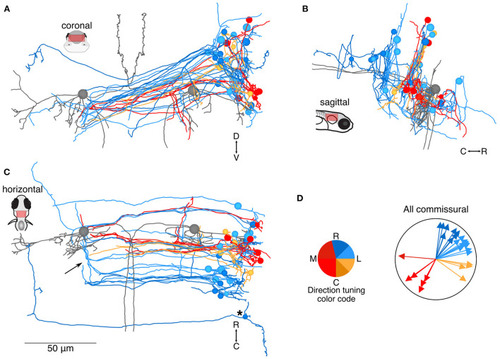
Location and directional tuning of identified commissural neurons receiving utricular input. (A) Coronal projection of reconstructions of 31 commissural neurons that receive direct utricular afferent input, colorized by their inferred directional tuning [see color code, (D)]. In addition, the left and right Mauthner cells are shown in gray to facilitate comparisons with other results. Note that the Mauthner cells are shown as spheres. Nearly all commissural utricular neurons follow a similar axon projection path. (B) Sagittal view of the same neuron reconstructions as in (A). Most of these commissural neurons are located caudally to the Mauthner cell bodies. (C) Horizontal view of the same neurons as in (A). Arrow points to a position where several commissural utricular axons can be seen to turn rostrally, in the same mediolateral position as the Mauthner cell body. Asterisk indicates the presumed tangential neuron described in text. Scale bar applies to (A–C). (D) Summary of the inferred directional tuning of commissural utricular neurons. Vector direction indicates the computed directional tuning of each neuron. Arrow lengths have been adjusted to facilitate visualization. |
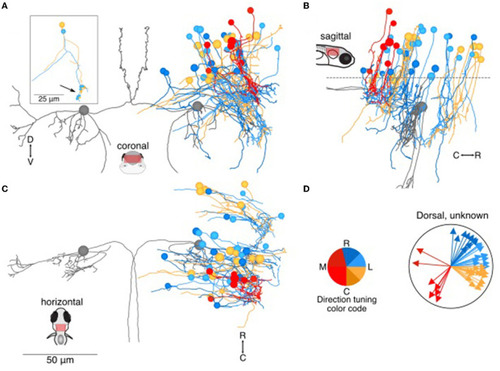
Location and directional tuning of dorsally located neurons receiving utricular input. (A) Coronal projection of reconstructions of 46 dorsal neurons (>20 μm dorsal to Mauthner cell) that receive direct utricular afferent input, colorized by their inferred directional tuning [see color code, (D)]. In addition, the left and right Mauthner cells are shown in gray to facilitate comparisons with other results. Inset, two example neurons with the locations of their synaptic inputs (arrow, small circles). The processes extending to the left of the reconstruction are presumed axons. (B) Sagittal view of the same neuron reconstructions as in (A). Dashed line indicates the plane separating dorsal neurons from ventral neurons in Figure 4. (C) Horizontal view of the same neurons as in (A). Scale bar applies to (A–C). (D) Summary of the inferred directional tuning of dorsal neurons with utricular input. Vector direction indicates the computed directional tuning of each neuron. Arrow lengths have been adjusted to facilitate visualization. |
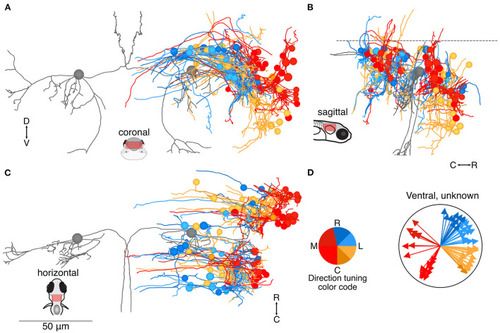
Location and directional tuning of ventrally located neurons receiving utricular input. (A) Coronal projection of reconstructions of 83 ventral neurons that receive direct utricular afferent input, colorized by their inferred directional tuning [see color code, (D)]. In addition, the left and right Mauthner cells are shown in gray to facilitate comparisons with other results. Neurons responsive to contralateral tilt (reds) are preferentially located on the lateral edge of the vestibular brainstem (see Figure 7). (B) Sagittal view of the same neuron reconstructions as in (A). Ventrally located neurons are distributed both rostrally and caudally to the Mauthner cell body. (C) Horizontal view of the same neurons as in (A). Scale bar applies to (A–C). (D) Summary of the inferred directional tuning of ventral neurons with utricular input. Vector direction indicates the computed directional tuning of each neuron. Arrow lengths have been adjusted to facilitate visualization. |
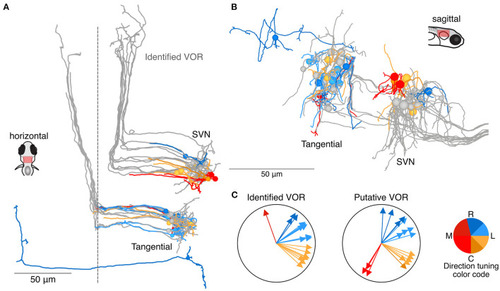
Utricular-recipient neurons putatively involved in the VOR. (A) Horizontal projection of reconstructions of 11 identified tangential nucleus and 12 identified superior vestibular nucleus neurons (grays) along with 11 putative tangential and 6 putative SVN neurons that receive direct utricular input (colors). Neurons were identified as putative VOR neurons based on soma position and initial axon trajectory. One putative tangential nucleus neuron (dark blue, caudally located) was identified based on apparent homology to commissural neurons described by Bianco et al. (B) Sagittal view of the same neuron reconstructions as in (A). (C) Summary of the inferred directional tuning of identified (left) and putative (right) VOR neurons with utricular input. |
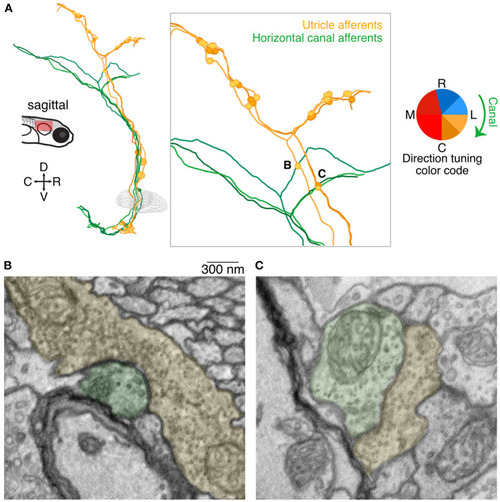
Axo-axonic synaptic connections from utricular afferents to horizontal canal afferents. (A) Sagittal projection of reconstructions of three utricular afferents (yellows) and three horizontal canal afferents (greens). Each utricular afferent makes a synaptic connection onto one canal afferent, shown as small circles in the inset panel. Notably all of these apparent connections were found in the ascending branch of the utricular afferent before its central bifurcation, where no other synaptic connections were identified. Inset letters indicate the two synaptic connections shown in panels B and C. (B) Electron micrograph of one of the axo-axonic synapses shown in (A). The utricular afferent (pseudocolored yellow) appears to have multiple release sites onto the canal afferent (pseudocolored green). Scale bar applies to both B and C. (C) As in (B), for a second connection. The postsynaptic density is less pronounced in this image, but nonetheless the clustered vesicles suggest a synaptic connection. |
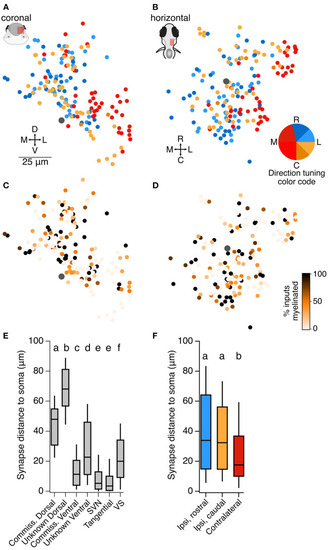
Organization of central utricular neurons by inferred directional tuning. (A) Summary of the inferred directional tuning of all neurons described here in the coronal plane. The Mauthner cell body is indicated by a large gray dot. Neurons predicted to respond to contralateral tilt (reds) are on average located more laterally than those responsive to ipsilateral tilt, Wilcoxon-Mann-Whitney test, p = 1.0 × 10⁻⁹. (B) As in (A), in the horizontal plane. Neurons predicted to respond to contralateral tilt are on average located more ventrally, Wilcoxon-Mann-Whitney test, p = 0.007. (C) Summary of the fraction of inputs that arise from myelinated vs. unmyelinated utricular afferents for all neurons described here. Darker colors represent more input from myelinated afferents (scale in D). Mauthner cell is indicated by a large gray dot. There is no apparent spatial organization of neurons receiving more or less myelinated input, although central neurons with myelinated axons receive more input from myelinated afferents (see Discussion). (D) As in (C), in the horizontal plane. (E) The average distance of utricular synaptic contacts from the soma, measured along the dendrite, for each of the classes of neurons described here. Dorsally located somata receive utricular synaptic input at a longer distance from the soma than ventrally located somata of the same class (compare commissural dorsal and ventral neurons, and unknown dorsal and ventral neurons). Box plot displays median and 25–75th % iles; whiskers are 10–90th % iles. Small lettering above bars represents statistical relationships. Although most groups are significantly different from each other, the differences in values are modest in most cases, with the exception of the dorsal and ventral populations. Pairwise comparisons for these groups: Wilcoxon-Mann-Whitney between commissural dorsal and commissural ventral (Figure 2), p = 4 × 10⁻¹⁰; between unknown dorsal and unknown ventral (Figures 3, ,4),4), p = 0. (F) The average distance of utricular synaptic contacts from the soma, measured along the dendrite, for central neurons separated by their inferred utricular tuning (not including SVN, tangential, and VS neurons). Neurons with inferred contralateral tilt sensitivity (red) received input significantly closer to the soma than neurons with inferred ipsilateral tilt sensitivity (blue, yellow). Small lettering above bars represents statistical relationships. Kruskal-Wallis test among all three groups, p = 0.005. Wilcoxon-Mann-Whitney tests between ipsi-rostral and ipsi-caudal groups, p = 0.35; between ipsi-rostral and contralateral, p = 0.002; between ipsi-caudal and contralateral, p = 0.005. |