
FIGURE
Fig. 4
- ID
- ZDB-FIG-220601-58
- Publication
- Lopez et al., 2022 - A New Zebrafish Model to Measure Neuronal α-Synuclein Clearance In Vivo
- Other Figures
- All Figure Page
- Back to All Figure Page
Fig. 4
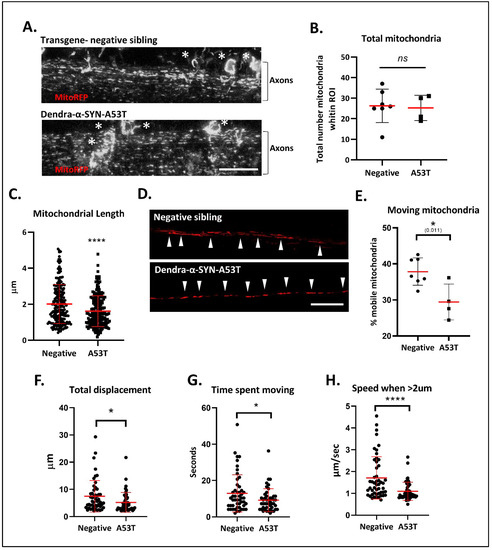
Figure 4. Defects in mitochondrial morphology and axonal transport. (A) Representative confocal images (max intensity z-stack projections) of labelled mitochondria in the spinal cord 72 h after the injection of NeuroD:mitoRFPTag construct into Dendra-α-SYN-A53T with pan-neuronal expression and transgene-negative siblings. Labelled mitochondria could be observed in the soma (white *) and the axonal projections (Axons). Scale bar represents 50 μm. (B) Graph represents the total number of mitochondria quantified within the same ROI area, localised to the center of the spinal cord in transgene-negative fish (Negative) and Dendra-α-SYN-A53T fish (A53T). No changes in total number were found, allowing the analysis of mitochondrial morphology and transport in comparative experiments. Data represented as mean (red line) ± s.d. (N ≧ 4 fish; ns p > 0.05 vs. negative) (C) Quantification of mitochondrial length within the same ROI. Mitochondria in Dendra-α-SYN-A53T fish were significantly smaller than in negative siblings. Data represented as mean (thick red line) ± s.d. (N = 200 mitochondria from minimum 4 fish; **** p < 0.0001 vs. negative) (D) Representative confocal images of RFP-positive mitochondria in a single plane of focus showing individual axonal tracks in transgene-negative and Dendra-α-SYN-A53T fish injected with NeuroD:mitoRFPTag construct. Scale bar represents 20 μm. (E) Graph representing the percentage of mobile mitochondria in single axons used for the motility analysis in videos. Data represented as mean (red line) ± s.d. (N ≧ of 4 videos from independent fish within the same group; * p < 0.01 vs. negative). (F–H) Quantification of mitochondrial motion across 125 μm of spinal cord axon in 1.03 s intervals. Overall mitochondrial transport was significantly reduced in Dendra-α-SYN-A53T-expressing axons compared to transgene-negative siblings. Mobile mitochondria in Dendra-α-SYN-A53T showed significantly less total displacement (F), less time moving (G) and, consequently, a slower speed (H). Data represented as mean (red line) ± s.d. (N = 46 mitochondria per group; (* p < 0.05, **** p < 0.0001 vs. negative).
|
Expression Data
Expression Detail
Antibody Labeling
Phenotype Data
| Fish: | |
|---|---|
| Observed In: | |
| Stage: | Protruding-mouth |
Phenotype Detail
Acknowledgments
This image is the copyrighted work of the attributed author or publisher, and
ZFIN has permission only to display this image to its users.
Additional permissions should be obtained from the applicable author or publisher of the image.
Full text @ Genes (Basel)