
FIGURE SUMMARY
- Title
-
A New Zebrafish Model to Measure Neuronal α-Synuclein Clearance In Vivo
- Authors
- Lopez, A., Gorb, A., Palha, N., Fleming, A., Rubinsztein, D.C.
- Source
- Full text @ Genes (Basel)
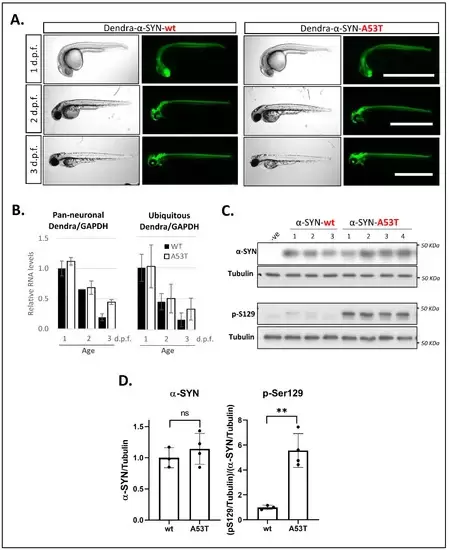
Figure 1. Expression of Dendra- α-SYN in transgenic zebrafish. (A) Representative brightfield and fluorescence images of Dendra-α-SYN positive offspring from stable UAS:Dendra-α-SYN-wt and A53T fish lines crossed to the PanN:Gal4VP16 driver fish at 1, 2 and 3 d.p.f. Expression localised to the CNS remains strong from 1 to 3 d.p.f. and does not result in morphological defects. Scale bar represents 1 mm. (B) Quantification by qPCR of the relative expression levels of Dendra/GAPDH in offspring from selected Dendra-α-SYN-wt (black) and A53T founder fish (white) showing comparable mRNA levels at 1, 2 and 3 d.p.f. when outcrossed to pan-neuronal or ubiquitous GAL4 driver lines (PanN:GAL4-VP16 and ubb:GAL4-VP16). Both groups showed reduced Dendra mRNA levels over time normalised by GAPDH. Data represents mean ± s.d. (N = 3 independent clutches for each age and genotype) (C) Western blot for total α-SYN and phosphorylated α-SYN at residue S129 (pS129) in whole fish lysates from 3 d.p.f. fish with pan-neuronal expression of Dendra-α-SYN-wt and A53T compared to tubulin levels as loading control. (D) Densitometry of total α-SYN and pS129 immunoblots in (C). The two transgenic lines had equivalent α-SYN levels relative to tubulin, whereas the levels of pS129 α-SYN were significantly increased in Dendra-α-SYN-A53T mutant fish, compared to α-SYN-wt (** p < 0.01 vs. α-SYN-wt).
EXPRESSION / LABELING:
PHENOTYPE:
|
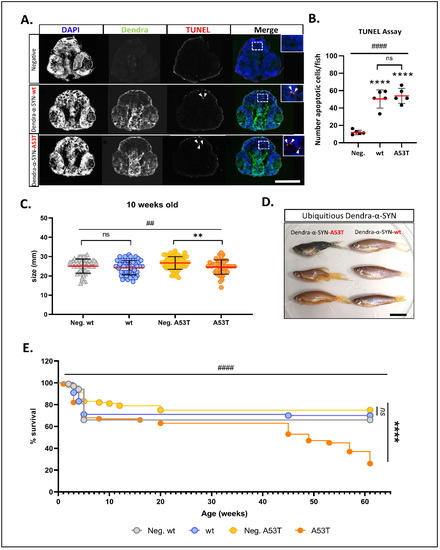
Figure 2. Characterisation of neuronal pathology and longevity in Dendra-α-SYN transgenic zebrafish. (A) Representative images of TUNEL labelling in the brains of larvae at 2 d.p.f. Pictures show DAPI, Dendra and TUNEL in transverse cryosections across the heads of embryos with pan-neuronal expression of Dendra-α-SYN-wt and A53T, compared to transgene-negative siblings imaged by epifluorescence microscope. Apoptotic nuclei are highlighted by white arrowheads in TUNEL images and shown at higher magnification in merge images. Scale bar represents 250 μm. (B) Quantification of the total number of apoptotic cells in 5 sections per fish detected by TUNEL assay. A significant increase in cell death was seen in fish expressing Dendra-α-SYN-wt (wt) or the A53T mutation, compared to transgene-negative siblings (Neg.). Data represented as mean (red line) ± s.d. (N = 5 fish per group, **** p < 0.0001 Dendra-α-SYN transgenics vs. Neg.; ns p > 0.05 Dendra-α-SYN-wt vs. A53T; #### p < 0.0001 ANOVA). (C) Graph represents the differences in body length of 10 weeks-old fish with ubiquitous expression of Dendra-α-SYN-wt and A53T related to their respective transgene-negative siblings (Neg. wt and Neg. A53T). Fish expressing mutant A53T showed significant reduced length (N = 47 fish per group, ** p < 0.005 vs. transgene-negative siblings; ## p < 0.005 ANOVA for whole data ser). (D) At 16 weeks old, fish with ubiquitous expression of Dendra-α-SYN-A53T (left) display overt morphological defects, such as bent spine and smaller heads, whereas Dendra-α-SYN-wt (right) appear normal. Scale bar represents 1 cm. (E) ubiquitous expression of Dendra-α-SYN-A53T reduced lifespan compared to Dendra-α-SYN-wt or non-expressors from 41 weeks old (N = 90 fish per group at beginning of the experiment, **** p < 0.0001 A53T vs. transgene-negative siblings; #### p < 0.0001 Log-rank (Mantel-Cox) for all 4 groups).
|
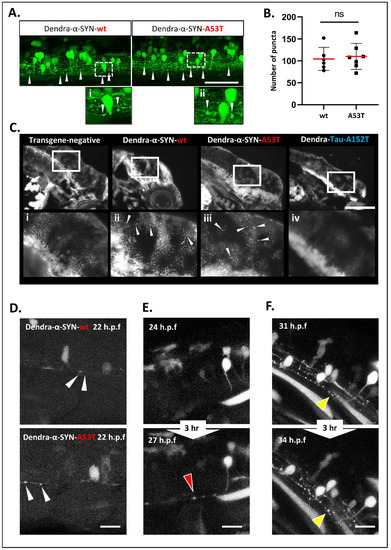
Figure 3. Accumulation and aggregation of Dendra-α-SYN. (A) Representative confocal images of the mosaic expression of Dendra-α-SYN in the spinal cord. Both Dendra-α-SYN-wt and A53T-expressing larvae showed bright puncta of Dendra signal along the axons (white arrowheads) in 3 d.p.f. fish. Images (i,ii) show puncta in axons in detail. Scale bar represents 150 µm. (B) Quantification of Dendra puncta seen in transverse sections across the head of 3 d.p.f larvae with pan-neuronal expression of Dendra-α-SYN-wt and A53T represented in Figure S3E. No changes were found in the number of puncta. Data represented as mean (red line) ± s.d. (N = minimum of 6 fish, ns p > 0.05) (C) Thioflavin-S staining of longitudinal sections through the brain of 3 d.p.f embryos with pan-neuronal expression of Dendra-α-SYN-wt and A53T. Positive staining was observed in α-SYN -wt and A53T fish in contrast to the absence of labelling in transgene-negative siblings or Dendra-tau-A152T expressors. Panels i-iv correspond to magnified images where arrowheads point to thioflavin-s positive structures. Scale bar represents 100 µm. (D–F) Representative confocal images from maximum projections of z-stacks of Dendra positive neurons in the spinal cord of mosaic Dendra-α-SYN-wt and A53T expressors at 22 h.p.f., showing the early presence of Dendra-α-SYN aggregates (white arrowheads in (D)), de novo formation of Dendra-α-SYN-A53T aggregates (red arrowhead in (E)), and the increase in size of aggregates within 3 h (31–34 h.p.f.) (yellow arrowheads in (F)). Scale bar represents 25 µm.
EXPRESSION / LABELING:
PHENOTYPE:
|
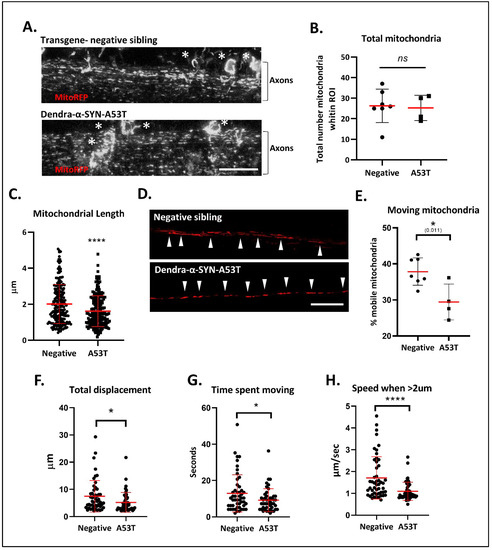
Figure 4. Defects in mitochondrial morphology and axonal transport. (A) Representative confocal images (max intensity z-stack projections) of labelled mitochondria in the spinal cord 72 h after the injection of NeuroD:mitoRFPTag construct into Dendra-α-SYN-A53T with pan-neuronal expression and transgene-negative siblings. Labelled mitochondria could be observed in the soma (white *) and the axonal projections (Axons). Scale bar represents 50 μm. (B) Graph represents the total number of mitochondria quantified within the same ROI area, localised to the center of the spinal cord in transgene-negative fish (Negative) and Dendra-α-SYN-A53T fish (A53T). No changes in total number were found, allowing the analysis of mitochondrial morphology and transport in comparative experiments. Data represented as mean (red line) ± s.d. (N ≧ 4 fish; ns p > 0.05 vs. negative) (C) Quantification of mitochondrial length within the same ROI. Mitochondria in Dendra-α-SYN-A53T fish were significantly smaller than in negative siblings. Data represented as mean (thick red line) ± s.d. (N = 200 mitochondria from minimum 4 fish; **** p < 0.0001 vs. negative) (D) Representative confocal images of RFP-positive mitochondria in a single plane of focus showing individual axonal tracks in transgene-negative and Dendra-α-SYN-A53T fish injected with NeuroD:mitoRFPTag construct. Scale bar represents 20 μm. (E) Graph representing the percentage of mobile mitochondria in single axons used for the motility analysis in videos. Data represented as mean (red line) ± s.d. (N ≧ of 4 videos from independent fish within the same group; * p < 0.01 vs. negative). (F–H) Quantification of mitochondrial motion across 125 μm of spinal cord axon in 1.03 s intervals. Overall mitochondrial transport was significantly reduced in Dendra-α-SYN-A53T-expressing axons compared to transgene-negative siblings. Mobile mitochondria in Dendra-α-SYN-A53T showed significantly less total displacement (F), less time moving (G) and, consequently, a slower speed (H). Data represented as mean (red line) ± s.d. (N = 46 mitochondria per group; (* p < 0.05, **** p < 0.0001 vs. negative).
PHENOTYPE:
|
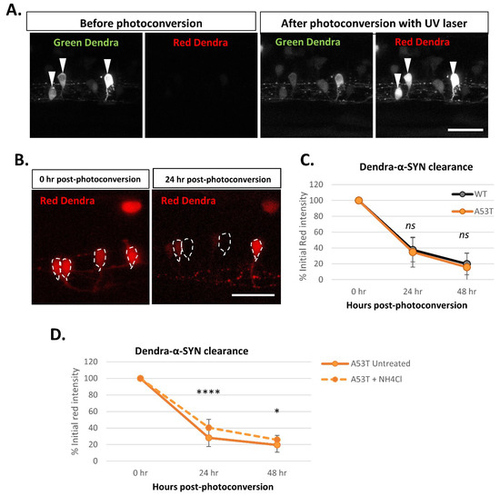
Figure 5. Dendra-α-SYN clearance kinetics in vivo. (A) Confocal images of the green and red fluorescent signal of Dendra-α-SYN in isolated neurons in the spinal cord of fish with mosaic expression of Dendra-α-SYN-A53T. Neurons with transgene-expression can be identified by its dendra-derived green signal. After UV (405 nm) exposure targeting the soma of selected neurons (white arrowheads), part of Dendra protein is photoconverted from green to red. As a consequence, the pool of green protein is reduced and red Dendra-α-SYN can be visualised. Scale bar represents 50 μm. (B) Confocal images showing the reduction in the red signal of photoconverted Dendra-α-SYN-A53T over time. Newly synthesised Dendra-α-SYN protein is green, whereas red signal corresponds to the residual red photoconverted- protein after UV exposure. Red signal within neurons (delimited by dashed-lines) reduces over time as a consequence of its degradation and can be used as a readout for clearance kinetics. Scale bar represents 50 μm. (C) Graph representing the decrease in the red-Dendra intensity in single neuronal cells in the spinal cord of Dendra-α-SYN-wt and A53T fish with mosaic expression. Dendra-α-SYN-wt and A53T clear at the same rate (N ≧ 30 neurons per group). (D) Changes in the clearance rate of Dendra- α-SYN-A53T after inhibition of autophagic flux by ammonium chloride (NH4Cl). NH4Cl delays the clearance of Dendra-α-SYN-A53T (N = minimum 30 neurons per group; * p < 0.05, **** p < 0.0001 vs. untreated α-SYN-A53T).
|
Acknowledgments
This image is the copyrighted work of the attributed author or publisher, and
ZFIN has permission only to display this image to its users.
Additional permissions should be obtained from the applicable author or publisher of the image.
Full text @ Genes (Basel)