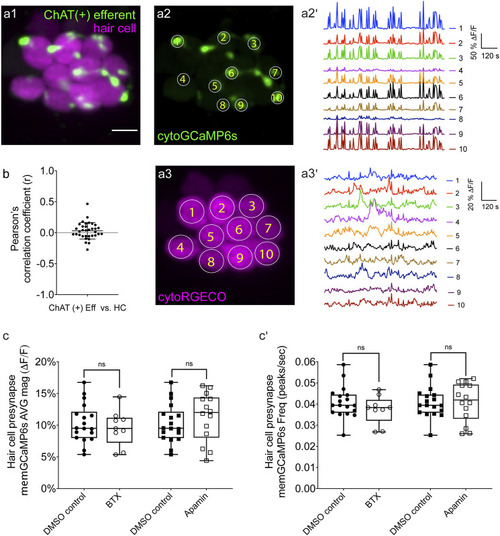
Two-color imaging of spontaneous activities in hair cells and cholinergic efferent terminals. (A1) A representative Max-projection image of a double-transgenic zebrafish line expressing the red GECI cytoRGECO1 in hair cells and the green GECI cytoGCaMP6s in the cholinergic efferents terminals at day 3. (A2) Image depicting cholinergic efferent terminals with individual terminals contacting different hair cells in (A1) are labeled accordingly. (A2′) The corresponding temporal curves of spontaneous calcium activities of the 10 efferent terminals indicated in (A2). (A3) Image of the individual hair cells in a1 labeled according to innervating efferent terminal. (A3′) The corresponding temporal curves of spontaneous calcium activities of the 10 hair cells indicated in (A3). (B) Pearson’s R values of spontaneous calcium activity between each hair cell and its contacting cholinergic efferent terminal, n = 34 hair cell-efferent terminal pairs from four neuromasts at day 3. Box plots showing the average magnitude (C) and frequency (C') of spontaneous calcium activity at the hair cell presynapse in DMSO and after the treatment with 10 μM α-Btx and 10 μM apamin. Each point in (C–C′) represents one neuromast. All measurements were performed in immature neuromasts at day 3. A paired t-test was used in (C–C′). Scale bar = 5 μm.
|
