
Figure 1—figure supplement 1.
- ID
- ZDB-FIG-220430-51
- Publication
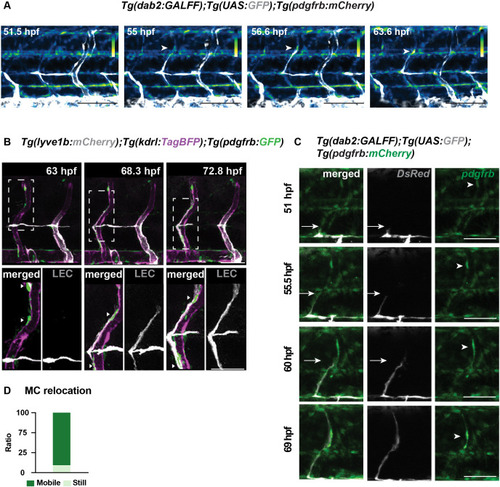
- Peng et al., 2022 - Proper migration of lymphatic endothelial cells requires survival and guidance cues from arterial mural cells
- Other Figures
-
- Figure 1
- Figure 1—figure supplement 1.
- Figure 1—figure supplement 2.
- Figure 2
- Figure 2—figure supplement 1.
- Figure 2—figure supplement 2.
- Figure 2—figure supplement 3.
- Figure 3
- Figure 3—figure supplement 1.
- Figure 3—figure supplement 2.
- Figure 3—figure supplement 3.
- Figure 4
- Figure 4—figure supplement 1.
- Figure 4—figure supplement 2.
- Figure 5
- Figure 5—figure supplement 1.
- Figure 5—figure supplement 2.
- All Figure Page
- Back to All Figure Page
( |