|
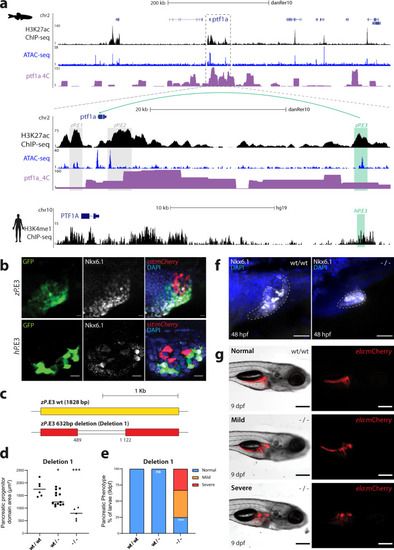
The zebrafish and human <italic>ptf1a/PTF1A</italic> regulatory landscapes contain a functional equivalent enhancer essential for pancreas development.a UCSC Genome Browser view of the zebrafish ptf1a and human PTF1A genomic landscapes showing H3K27ac ChIP-seq (black), ATAC-seq (blue) and ptf1a 4 C interactions (purple) from whole zebrafish pancreas samples (upper panel), with a zoom-in (middle panel), and H3K4me1 ChIP-seq data2 (black) from human embryonic pancreatic progenitors (lower panel). Grey boxes highlight two previously validated zebrafish enhancers, zP.E1 and zP.E2 in the vicinity of the ptf1a gene. Green boxes highlight a distal enhancer in zebrafish, zP.E3, and the location of its putative human functional ortholog hP.E3. b Confocal images of zebrafish reporter stable transgenic lines Tg(zP.E3:GFP) (n = 10) and Tg(hP.E3:GFP) (n = 3), showing co-localization of GFP expression (green) with Nkx6.1 (white), a marker of pancreatic progenitors, at 48 hpf. Delta-cells of the endocrine pancreas express mCherry (red) and nuclei are labelled with DAPI (blue). Scale bar: 25 μm. c Schematic depiction of the CRISPR-Cas9 mediated 632 bp deletion (Deletion 1) of the zP.E3 enhancer. d Pancreatic progenitor domain area, defined by Nkx6.1 (white), of homozygous (−/−; n = 5), heterozygous (wt/−; n = 13) and wild type (wt/wt; n = 6) embryos for Deletion1 of zP.E3, at 48 hpf. Unpaired student’s t-test (two-tailed), p-values < 0.05 were considered significant (*p = 0.017, ***p = 0.0002). e Percentage of larvae (−/−, n = 12; wt/−, n = 14 and wt/wt, n = 12) with different pancreatic phenotypic defects (normal, mild and severe) at 9 dpf. Fisher’s exact test (two-sided), p-values < 0.05 were considered significant (***p = 0.0003). f Representative confocal images (maximum intensity projections) of the pancreatic progenitor domain (yellow dashed line) of zP.E3wt/wt (n = 6) and zP.E3−/− sibling embryos (n = 5) at 48 hpf. Nuclei are stained with DAPI. Scale bar: 25 μm. g Epifluorescence live images of representative phenotypes quantified in e). Scale bar: 250 μm. ela elastase, sst somatostatin. For d, e, source data are provided as a Source Data file.
|