FIGURE SUMMARY
Title

Multidimensional chromatin profiling of zebrafish pancreas to uncover and investigate disease-relevant enhancers

Authors
Bordeira-Carriço, R., Teixeira, J., Duque, M., Galhardo, M., Ribeiro, D., Acemel, R.D., Firbas, P.N., Tena, J.J., Eufrásio, A., Marques, J., Ferreira, F.J., Freitas, T., Carneiro, F., Goméz-Skarmeta, J.L., Bessa, J.
Source
Full text @ Nat. Commun.

The zebrafish pancreas, from histology to chromatin state.

a Comparison of the basic structure of the human and zebrafish adult pancreas. Above: Dissected adult male Tg(insulin:GFP, elastase:mCherry) zebrafish; insulin and elastase promoters drive GFP expression in beta-cells (green) and mCherry in acinar cells (red), respectively. IN, intestine; LRL, Liver right lobe; LT, left testis; PI, principal islet; SI, secondary islets; SB, swim bladder. Below: Histology of the pancreas; transverse sections with hematoxylin/eosin staining showing islets of Langerhans (black dashed lines) surrounded by exocrine tissue in zebrafish and human pancreas. Magnification: ×40 and scale bar: 1 mm. b Genomic landscape of gata6 in the zebrafish adult pancreas showing the H3K27ac ChIP-seq profile (black) and ATAC-seq peaks (blue) from whole pancreas, RNA-seq from exocrine pancreas (green) and a heat map for chromatin interactions with gata6 promoter detected by HiChIP for H3K4me3 from whole pancreas (below). A putative enhancer sequence that interacts with the gata6 promoter is highlighted by the light blue box. c Bar plot (left panel) showing the number of genes with active promoters (defined by H3K4me3 signal, gray bar) and putative active enhancers in adult zebrafish pancreas (defined by H3K27ac mark, green bar), and their distribution throughout the regions of the genome (right panel). d Above: Venn diagram showing the overlap of putative active enhancers in adult zebrafish pancreas and stages of zebrafish embryonic development. Putative active enhancers exclusive to the adult pancreas form the pancreas-specific enhancers (PsE) group, while the shared enhancers belong to the developmental shared enhancers (DevE) group (Supplementary Dataset 1e, f). Below: Heat maps showing clusters of H3K27ac mark for PsE and DevE enhancers during embryonic development [dome, 80% epiboly (80%epi), 24 hpf, 48 hpf] and in adult pancreas. A window of 10 kb around the reference coordinates for each sequence was used and the density files were subjected to k-means clustering, obtaining four different clusters in DevE: C1, Cluster 1; C2, Cluster 2; C3, Cluster 3; and C4, Cluster 4. For c, d, source data are provided as a Source Data file.

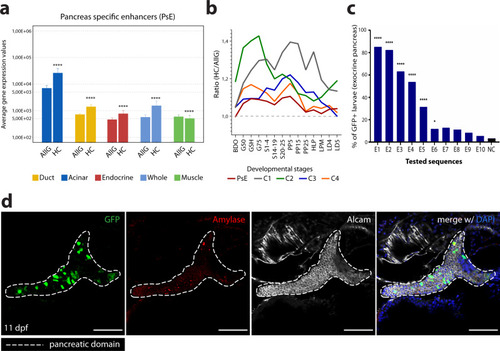
ChIP-seq and ATAC-seq data accurately predict functional pancreatic enhancers.

a Average expression of genes interacting with putative pancreas-specific enhancer sequences (PsE), detected by HiChIP for H3K4me3 (HC, n = 6174 genes), compared to the average expression of all genes (AllG, n = 33737 genes). Gene expression was determined from RNA-seq data from different pancreatic cells (acinar n = 4, duct n = 3, endocrine pancreas n = 4), whole pancreas (n = 2), and muscle (control; n = 2). One-sided Wilcoxon test (≥), p-values < 0.05 were considered statistically significant (****p < 2E−16). Error bars represent the 95% confidence interval. b Ratio between average expression of genes interacting with putative pancreatic enhancers (PsE, C1, C2, C3 and C4 clusters) and the average expression of all genes throughout zebrafish development. C1, C2, C3 and C4 are different clusters that compose the DevE category. BDO: blastula, dome; G50: gastrula, 50% epiboly; GSH: gastrula, shield; G75: gastrula, 75% epiboly, S1–4: segmentation, 1–4 somites; S14–19: segmentation, 14–19 somites; S20–25: segmentation, 20–25 somites; PP5: pharyngula, Prim-5; PP15: pharyngula, Prim-15; PP25: pharyngula, Prim-25; HLP: hatching, long-pec; LPM: larval, protruding-mouth; LD4: larval, day 4; LD5: larval, day 5. c Percentage of F0 zebrafish larvae with GFP expression in the exocrine pancreas following in vivo transient transgenesis reporter assays. The empty enhancer reporter vector was used as the negative control (NC). The depicted sequences (E1 to 10) represent the top 10 putative enhancer sequences with higher H3K27ac signal (“high H3K27ac” group). Values are represented as percentages and compared by two-sided Chi-square with Yates’ correction test. p-values<0.05 were considered significant (****p < 0.0001, *p < 0.05). The exact p-value and n are discriminated in Supplementary Dataset 4. d Representative confocal image of the in vivo transient transgenesis reporter assays for the E3 sequence (n = 30). depicted in c) showing expression of GFP (green) in 11 dpf zebrafish pancreas (white dashed line), labelled by anti-Alcam staining (white) and anti-Amylase (red) antibodies (n = 30, from 2 independent injections, with 63.33% of larvae showing GFP expression in the exocrine pancreas). Nuclei were stained with DAPI (blue). Images were captured with a Leica SP5II confocal microscope. Scale bar: 60 µm. For ac, source data are provided as a Source Data file.

The zebrafish and human pancreas share cis-regulatory similarities.

a Percentage of predicted zebrafish pancreatic enhancer sequences aligned to the human genome. Sequences are grouped in different clusters: “Pancreas” that includes PsE and DevE; “PsE”; “DevE”; “Embryo” that include putative enhancers active only during embryonic development. b PhastCons scores (99 vertebrate genomes against hg38) for human sequences converted from zebrafish putative enhancers. Grey dots label conserved sequences that do not overlap with H3K27ac mark in human pancreas (Pancreas-1801, PsE-1017, DevE-784 and Embryo-6792). Blue dots label conserved sequences that also show H3K27ac signal in human pancreas (ENCODE data; Pancreas-227, PsE-112, DevE-115). Green diamonds: average (grey dots: 0.40, 0.42, 0.36, 0.39; blue dots: 0.36, 0.41, 0.34, respectively for Pancreas, PsE, DevE and Embryo). Red line: median (grey dots: 0.10, 0.17, 0.05, 0.08; blue dots: 0.06, 0.09, and 0.03, respectively for pancreas, PsE, DevE and Embryo). The Embryo dataset is composed by different developmental stages (Dome, 80% Epiboly, 24 hpf and 48 hpf). c Ratio between the number of human sequences conserved with the zebrafish putative active enhancers (Pancreas-3.21, PsE-2.79, DevE-3.76 or Embryo-1.76) overlapping H3K27ac signal in human pancreas (ENCODE data) over the average of a 105 random shuffling of human sequences overlapping with H3K27ac signal in human pancreas (Supplementary Dataset 3q; empirical p-value < 1E−5). d Heatmap showing -log10(p-values) from hypergeometric enrichment test for pancreatic disease association on the genes linked by HiChIP to each enhancer cluster. Represented values meet the criteria: q-value ≤ 0.05 and fold enrichment≥1.5. e Genomic landscape of the human INSR gene (top) and zebrafish arid1ab ortholog (bottom), showing H3K27ac signal and predicted super-enhancers (blue). f Relevant pancreas transcription factors whose binding motifs are enriched in zebrafish pancreas H3K27ac ChIP-seq data. g Venn diagram of the top 140 enriched TFBS motifs in H3K27ac positive sequences in three different datasets: zebrafish pancreas (ZP), human pancreas (HP) and dome+80%epiboly embryos (D80). Number of motifs shared between pairs of groups (arrows). p-values are described (p; hypergeometric enrichment test). The enrichment of the observed vs expected is represented (E). p-values ≤ 0.05 were considered significant. For ad, g, source data provided in Source Data file.

The zebrafish and human <italic>arid1ab/ARID1A</italic> regulatory landscapes contain an equivalent pancreatic enhancer.

a Genomic landscape of the zebrafish arid1ab gene, showing profiles for H3K27ac ChIP-seq (black), ATAC-seq (blue) and 4 C with viewpoint in the arid1ab promoter (magenta) in adult zebrafish pancreas (top); zoom-in in arid1ab regulatory landscape (middle). Human ARID1A genomic landscape (bottom) with H3K27ac enriched intervals from human pancreatic cell lines (HPCL, black bars, top-to-bottom: PT-45-P1, CFPAC-1 and HPAF-II), H3K27ac profile from human pancreas (WPT, black) and from non-pancreatic human cell lines (NPHCL; GM12878, H1-hESC, HSMM, HUVEC, K562, NHEK and NHLF; Data from ENCODE). Human/zebrafish sequence conservation (dark green). Tested putative enhancers are highlighted in grey (zA.E1 and zA.E3; no enhancer activity) and green (zA.E2, zA.E4 and hA.E4; enhancer activity). Zebrafish/human syntenic box (red box). b Transient in vivo enhancer reporter assays of zA.E4 and hA.E4 showing the percentage of zebrafish embryos with GFP expression in endocrine, acinar and duct cells (two-sided chi-square test with Yates correction; *p < 0.05; Endocrine cells: zA.E4, p = 0.0001; hA.E4, p = 0.0294; Acinar cells: zA.E4, p = 0.0391; hA.E4, p = 0.1167; Duct cell: zA.E4, p = 0.00001; hA.E4, p = 0.9731). Number of analysed embryos (n). Negative control (NC). c Luciferase enhancer reporter assays performed in human hTERT-HPNE cells for hA.E4, showing luc2/Nluc ratios, relative to the negative control (two-sided t-test; ****p < 0.0001; hA.E4 p-value = 0.0001; PC p-value < 0.0001). Data from three biological replicates (grey dots, n = 3) and Mean±SD (error bar). Negative control (NC). Positive control (PC). d Strategy for CRISPR-Cas9 deletions in the hA.E4 locus, indicating sgRNA target sites. e Representative images of transfected hTERT-HPNE human cells expressing pairs of sgRNAs and Cas9 (arrows). In control, sgRNAs target a H3K27ac depleted region, while sgRNAs in sgPair1 and sgPair2 target the hA.E4 locus. Left column show anti-ARID1A (grey) and right column GFP (green), mCherry (red) and DAPI (blue; nuclei). Representative images from three biological replicates. Scale bar: 40 μm. f Normalized ARID1A levels from immunocytochemistry images. Two-sided t-test depicted for p ≤ 0.05(*), p ≤ 0.01(**) and not significant (ns; p-values of: Control vs sgPair1 = 0.0208, Control vs sgPair2 = 0.0044, sgPair1 vs sgPair2 = 0.6227). A black line represents the mean of values. Data from three biological replicates. Data included in Source Data file for b, c, f.

The zebrafish and human <italic>ptf1a/PTF1A</italic> regulatory landscapes contain a functional equivalent enhancer essential for pancreas development.

a UCSC Genome Browser view of the zebrafish ptf1a and human PTF1A genomic landscapes showing H3K27ac ChIP-seq (black), ATAC-seq (blue) and ptf1a 4 C interactions (purple) from whole zebrafish pancreas samples (upper panel), with a zoom-in (middle panel), and H3K4me1 ChIP-seq data2 (black) from human embryonic pancreatic progenitors (lower panel). Grey boxes highlight two previously validated zebrafish enhancers, zP.E1 and zP.E2 in the vicinity of the ptf1a gene. Green boxes highlight a distal enhancer in zebrafish, zP.E3, and the location of its putative human functional ortholog hP.E3. b Confocal images of zebrafish reporter stable transgenic lines Tg(zP.E3:GFP) (n = 10) and Tg(hP.E3:GFP) (n = 3), showing co-localization of GFP expression (green) with Nkx6.1 (white), a marker of pancreatic progenitors, at 48 hpf. Delta-cells of the endocrine pancreas express mCherry (red) and nuclei are labelled with DAPI (blue). Scale bar: 25 μm. c Schematic depiction of the CRISPR-Cas9 mediated 632 bp deletion (Deletion 1) of the zP.E3 enhancer. d Pancreatic progenitor domain area, defined by Nkx6.1 (white), of homozygous (−/−; n = 5), heterozygous (wt/−; n = 13) and wild type (wt/wt; n = 6) embryos for Deletion1 of zP.E3, at 48 hpf. Unpaired student’s t-test (two-tailed), p-values < 0.05 were considered significant (*p = 0.017, ***p = 0.0002). e Percentage of larvae (−/−, n = 12; wt/−, n = 14 and wt/wt, n = 12) with different pancreatic phenotypic defects (normal, mild and severe) at 9 dpf. Fisher’s exact test (two-sided), p-values < 0.05 were considered significant (***p = 0.0003). f Representative confocal images (maximum intensity projections) of the pancreatic progenitor domain (yellow dashed line) of zP.E3wt/wt (n = 6) and zP.E3−/− sibling embryos (n = 5) at 48 hpf. Nuclei are stained with DAPI. Scale bar: 25 μm. g Epifluorescence live images of representative phenotypes quantified in e). Scale bar: 250 μm. ela elastase, sst somatostatin. For d, e, source data are provided as a Source Data file.

Acknowledgments
This image is the copyrighted work of the attributed author or publisher, and ZFIN has permission only to display this image to its users. Additional permissions should be obtained from the applicable author or publisher of the image. Full text @ Nat. Commun.